VISA Stock Forecast 2025 – 2050 with detailed analysis

➡️ 30 Seconds Summary ⬅️
Visa Inc. (NYSE: V) is a global leader in digital payments, powering transactions across more than 200 countries and territories. As the financial world continues to shift towards cashless solutions and advanced fintech infrastructure, Visa remains a pivotal player in the evolution of the global economy. In this blog post “VISA Stock Forecast 2025-2050 with Detailed Analysis“, we present a detailed long-term forecast for Visa’s stock performance from 2025 to 2050.
Backed by historical data, market trends, and forward-looking analysis, this guide aims to help investors make informed decisions about Visa’s potential over the coming decades. We will also compare VISA’s performance with major indices like DOW & NASDAQ as well as with its peer companies. We will also analyze VISA stock on different timeframes and based on this analysis, we will estimate its prices for near & far future which will help you to decide, whether to invest in VISA or not.
About VISA Inc. (NYSE : V)
| Company Name | VISA Inc. |
| Stock Exchange | NYSE |
| Ticker Symbol | V |
| Sector | Finance |
| Headquarter | California, US |
| Founded in | 1958 |
| Major Shareholder | Vanguard Group (~8.94%) |
| Market Cap. | $ 659.36 billion USD |
| Revenue | $ 35.93 billion USD |
| Total Assets | $ 94.51 billion USD |
| All-time HIGH price | $ 366.54 USD (Mar 03, 2025) |
| All-time LOW price (since 2015) | $ 60.00 USD (Aug 26, 2015) |
| Peer Companies | Mastercard Incorporated (MA), Fiserv Inc. (FI), PayPal Holdings Inc. (PYPL), Adyen N.V. (ADYEY) |
Founded in 1958, Visa Inc. is a 67-year-old global financial services corporation renowned for facilitating electronic funds transfers worldwide. Visa operates one of the largest payment networks, connecting consumers, businesses, financial institutions, and governments in over 200 countries. With a strong market capitalization of approximately $659.36 billion USD and annual revenue of $35.93 billion USD, Visa continues to lead the digital payments industry by offering secure, innovative, and reliable transaction solutions. Let’s analyze its historical performance first, for better understanding of its future performance later.
VISA Inc. (NYSE : V) | Past, Present & Future
VISA Inc. (V) | Historical price analysis
| Year | Open | High | Low | Close | % Change |
|---|---|---|---|---|---|
| 2024 | 259.61 | 321.62 | 252.70 | 316.04 | +21.39% |
| 2023 | 209.28 | 263.25 | 206.16 | 260.35 | +25.31% |
| 2022 | 217.52 | 235.85 | 174.60 | 207.76 | -4.13% |
| 2021 | 220.25 | 252.67 | 190.10 | 216.71 | -0.92% |
| 2020 | 189.00 | 220.39 | 133.93 | 218.73 | +16.41% |
In the above table, we can clearly see that VISA stock price gave mostly positive results to its investors every year. VISA stock price hit its all-time high of $366.54 in March, 2025.
Also Read : JPMorgan Chase & Co. – JPM stock forecast 2025-2050 with detailed analysis🚨
Live chart analysis for VISA Stock Price Forecast
Before we start looking at the future values of VISA Stock Prices, have a closer look at its live chart. Here, in VISA’s stock chart, we can observe that, since October 2025, VISA’s stock is trading in the upward direction. With some corrections of-course, VISA reached a height of $366.54 per share starting from $174.60 on Oct 13, 2022. After hitting its all time high, investors started some profit-booking in VISA’s stock. After some profit booking, VISA stock tried to regain its strength but failed. VISA is still trying to continue its upward direction. If you are looking for a fresh buy, we will suggest you to wait for some time & buy it only after a new breakout.
Time-Frame analysis of VISA Inc. : Daily, Weekly, Monthly, Yearly
By a technical chart analysis of Simple Moving Averages (SMAs) on different timeframes, we can observe the following –
| Time Frame | Observation |
|---|---|
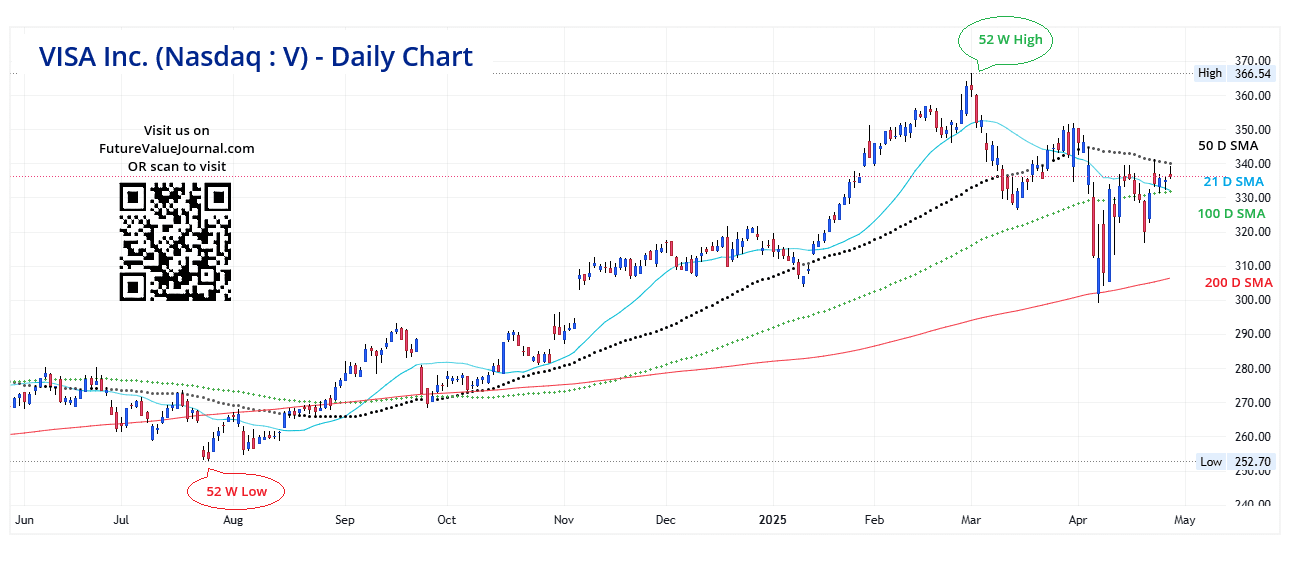 View Daily Chart (Every candle represents VISA share’s trading session of one day. Each single candle represent the HIGH, LOW, OPEN, CLOSE of that particular day) | On the Daily time-frame VISA stock is trading BELOW 50 Days, but ABOVE 21 Days, 100 Days & 200 Days SMAs. This indicates that VISA stock has a Sideways to Bullish sentiment in medium term. |
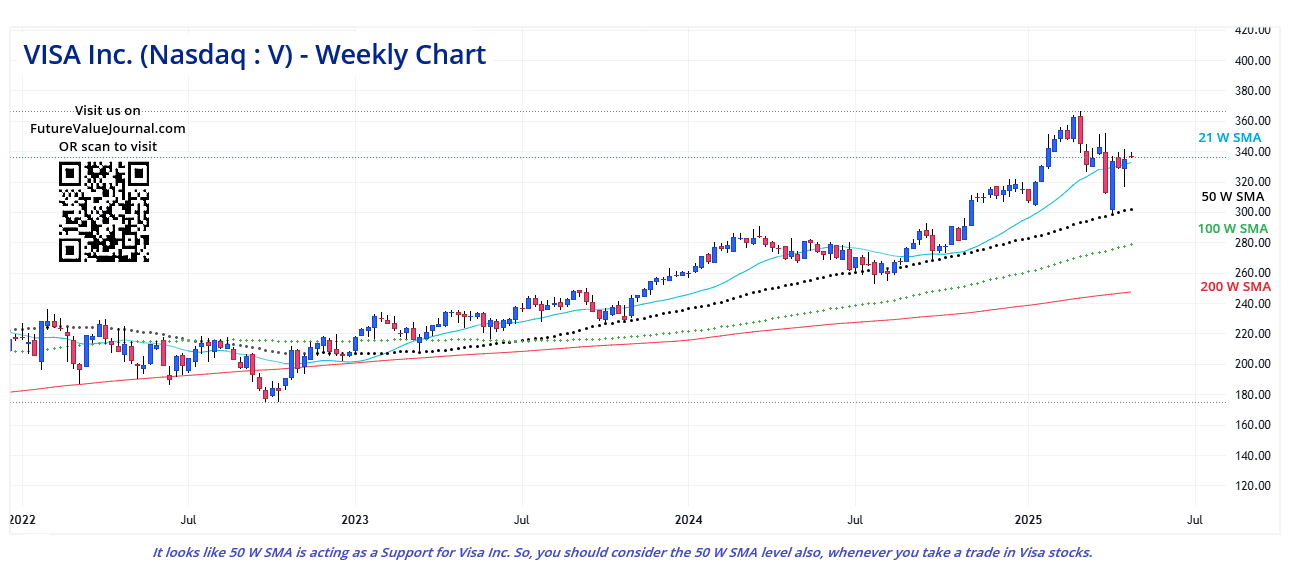 View Weekly Chart (Every candle represents VISA share’s trading session of one week. Each single candle represent the HIGH, LOW, OPEN, CLOSE of that particular week) | On Weekly time-frame, we can observe that VISA stock is trading ABOVE all the 21 Weeks, 50 Weeks, 100 Weeks & 200 Weeks SMAs . This is the clear sign of Sideways to BULLISH trend in Long term. |
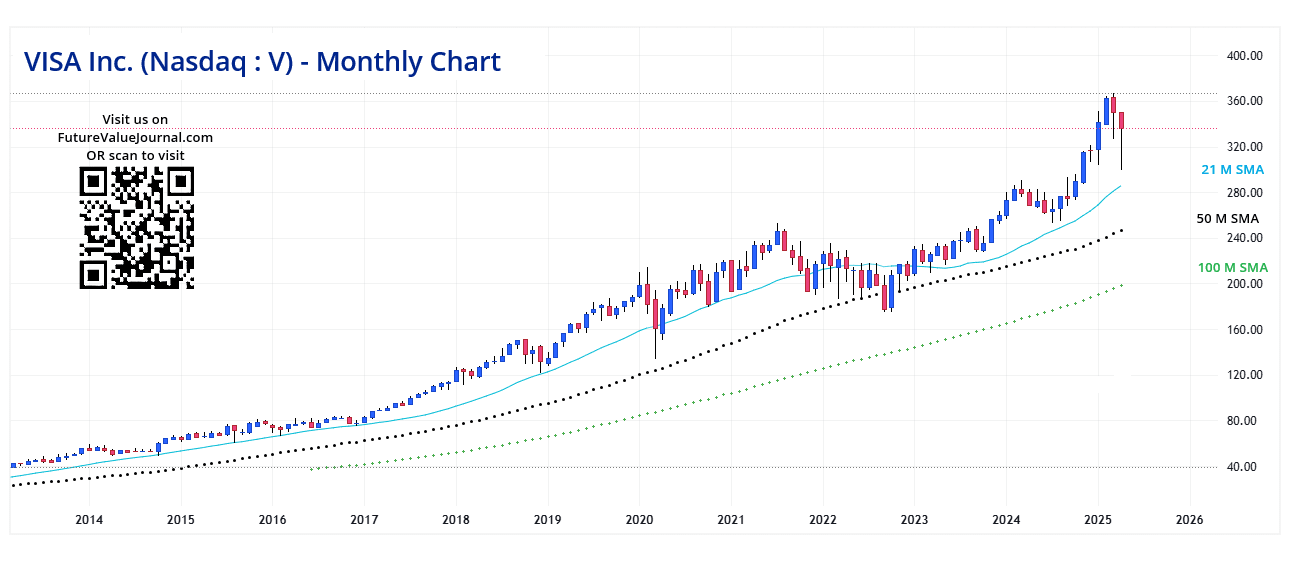 View Monthly Chart (Every candle represents VISA stock’s trading session of one month. Each single candle represent the HIGH, LOW, OPEN, CLOSE of that particular month) | On Monthly time-frame, we can observe that VISA stock is trading ABOVE 21 Months, 50 Months & 100 Months SMAs. This indicates that the VISA stock is in BULLISH trend for Very Long term. |
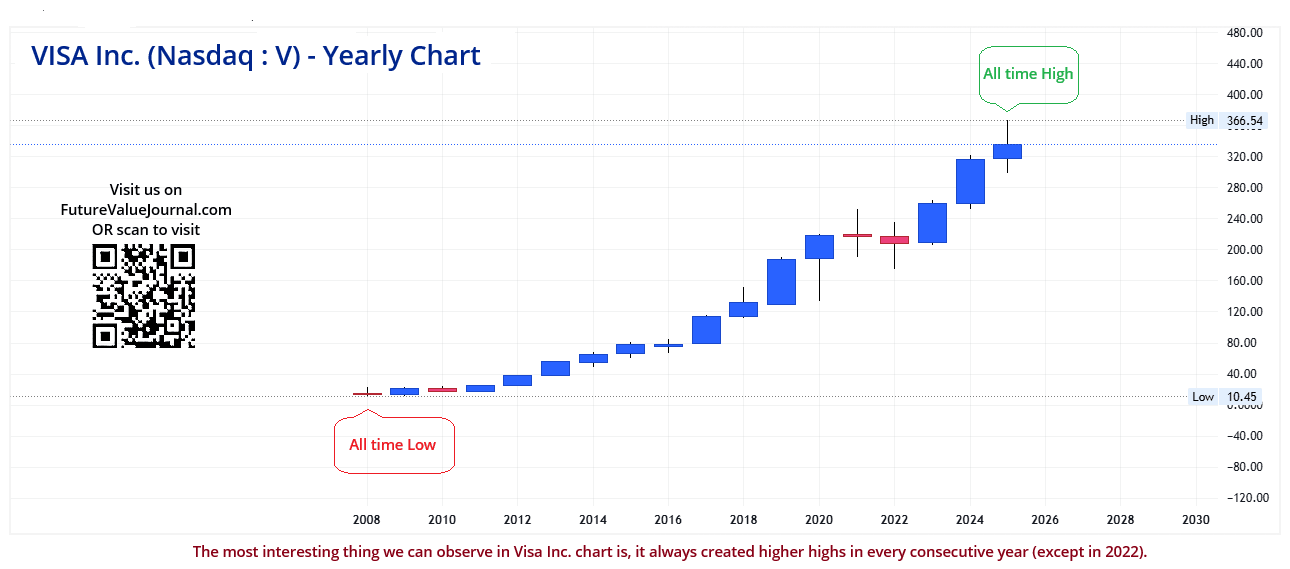 View Yearly Chart (Every candle represents VISA stock’s trading session of one year. Each single candle represent the HIGH, LOW, OPEN, CLOSE of that particular year) | In the yearly chart also, we can clearly see VISA’s price moment. It gained momentum since its starting point 2021. The most interesting thing we can observe is, VISA’s stock always gave positive returns to its investors. (except in 2022) |
The major support can be seen at the levels between $290 – $270. If we go for the directional analysis of the SMAs, we can see a Sideways to Bullish trend in SMAs directions in multiple timeframes.
Dow Jones, Nasdaq & VISA : A comparative Analysis
Check out the comparative year on year returns of Dow Jones, Nasdaq and VISA Inc.. Here, we are showing the returns by comparing them on closing basis –
| Year | Dow Jones | Nasdaq | V |
|---|---|---|---|
| 2024 | +12.88% | +28.64% | +21.39% |
| 2023 | +13.70% | +43.42% | +25.31% |
| 2022 | -8.78% | -33.10% | -4.13% |
| 2021 | +18.73% | +21.39% | -0.92% |
| 2020 | +7.25% | +43.64% | +16.41% |
Here in the above table, we can clearly see that their is a correlation between Dow – Nasdaq & VISA stocks. The returns of VISA are also similar to DOW & Nasdaq.
Also Read : 💳 AXP | American Express Stock Forecast 2025-2050 with Complete Analysis
VISA Peer Comparison / Competitors Analysis
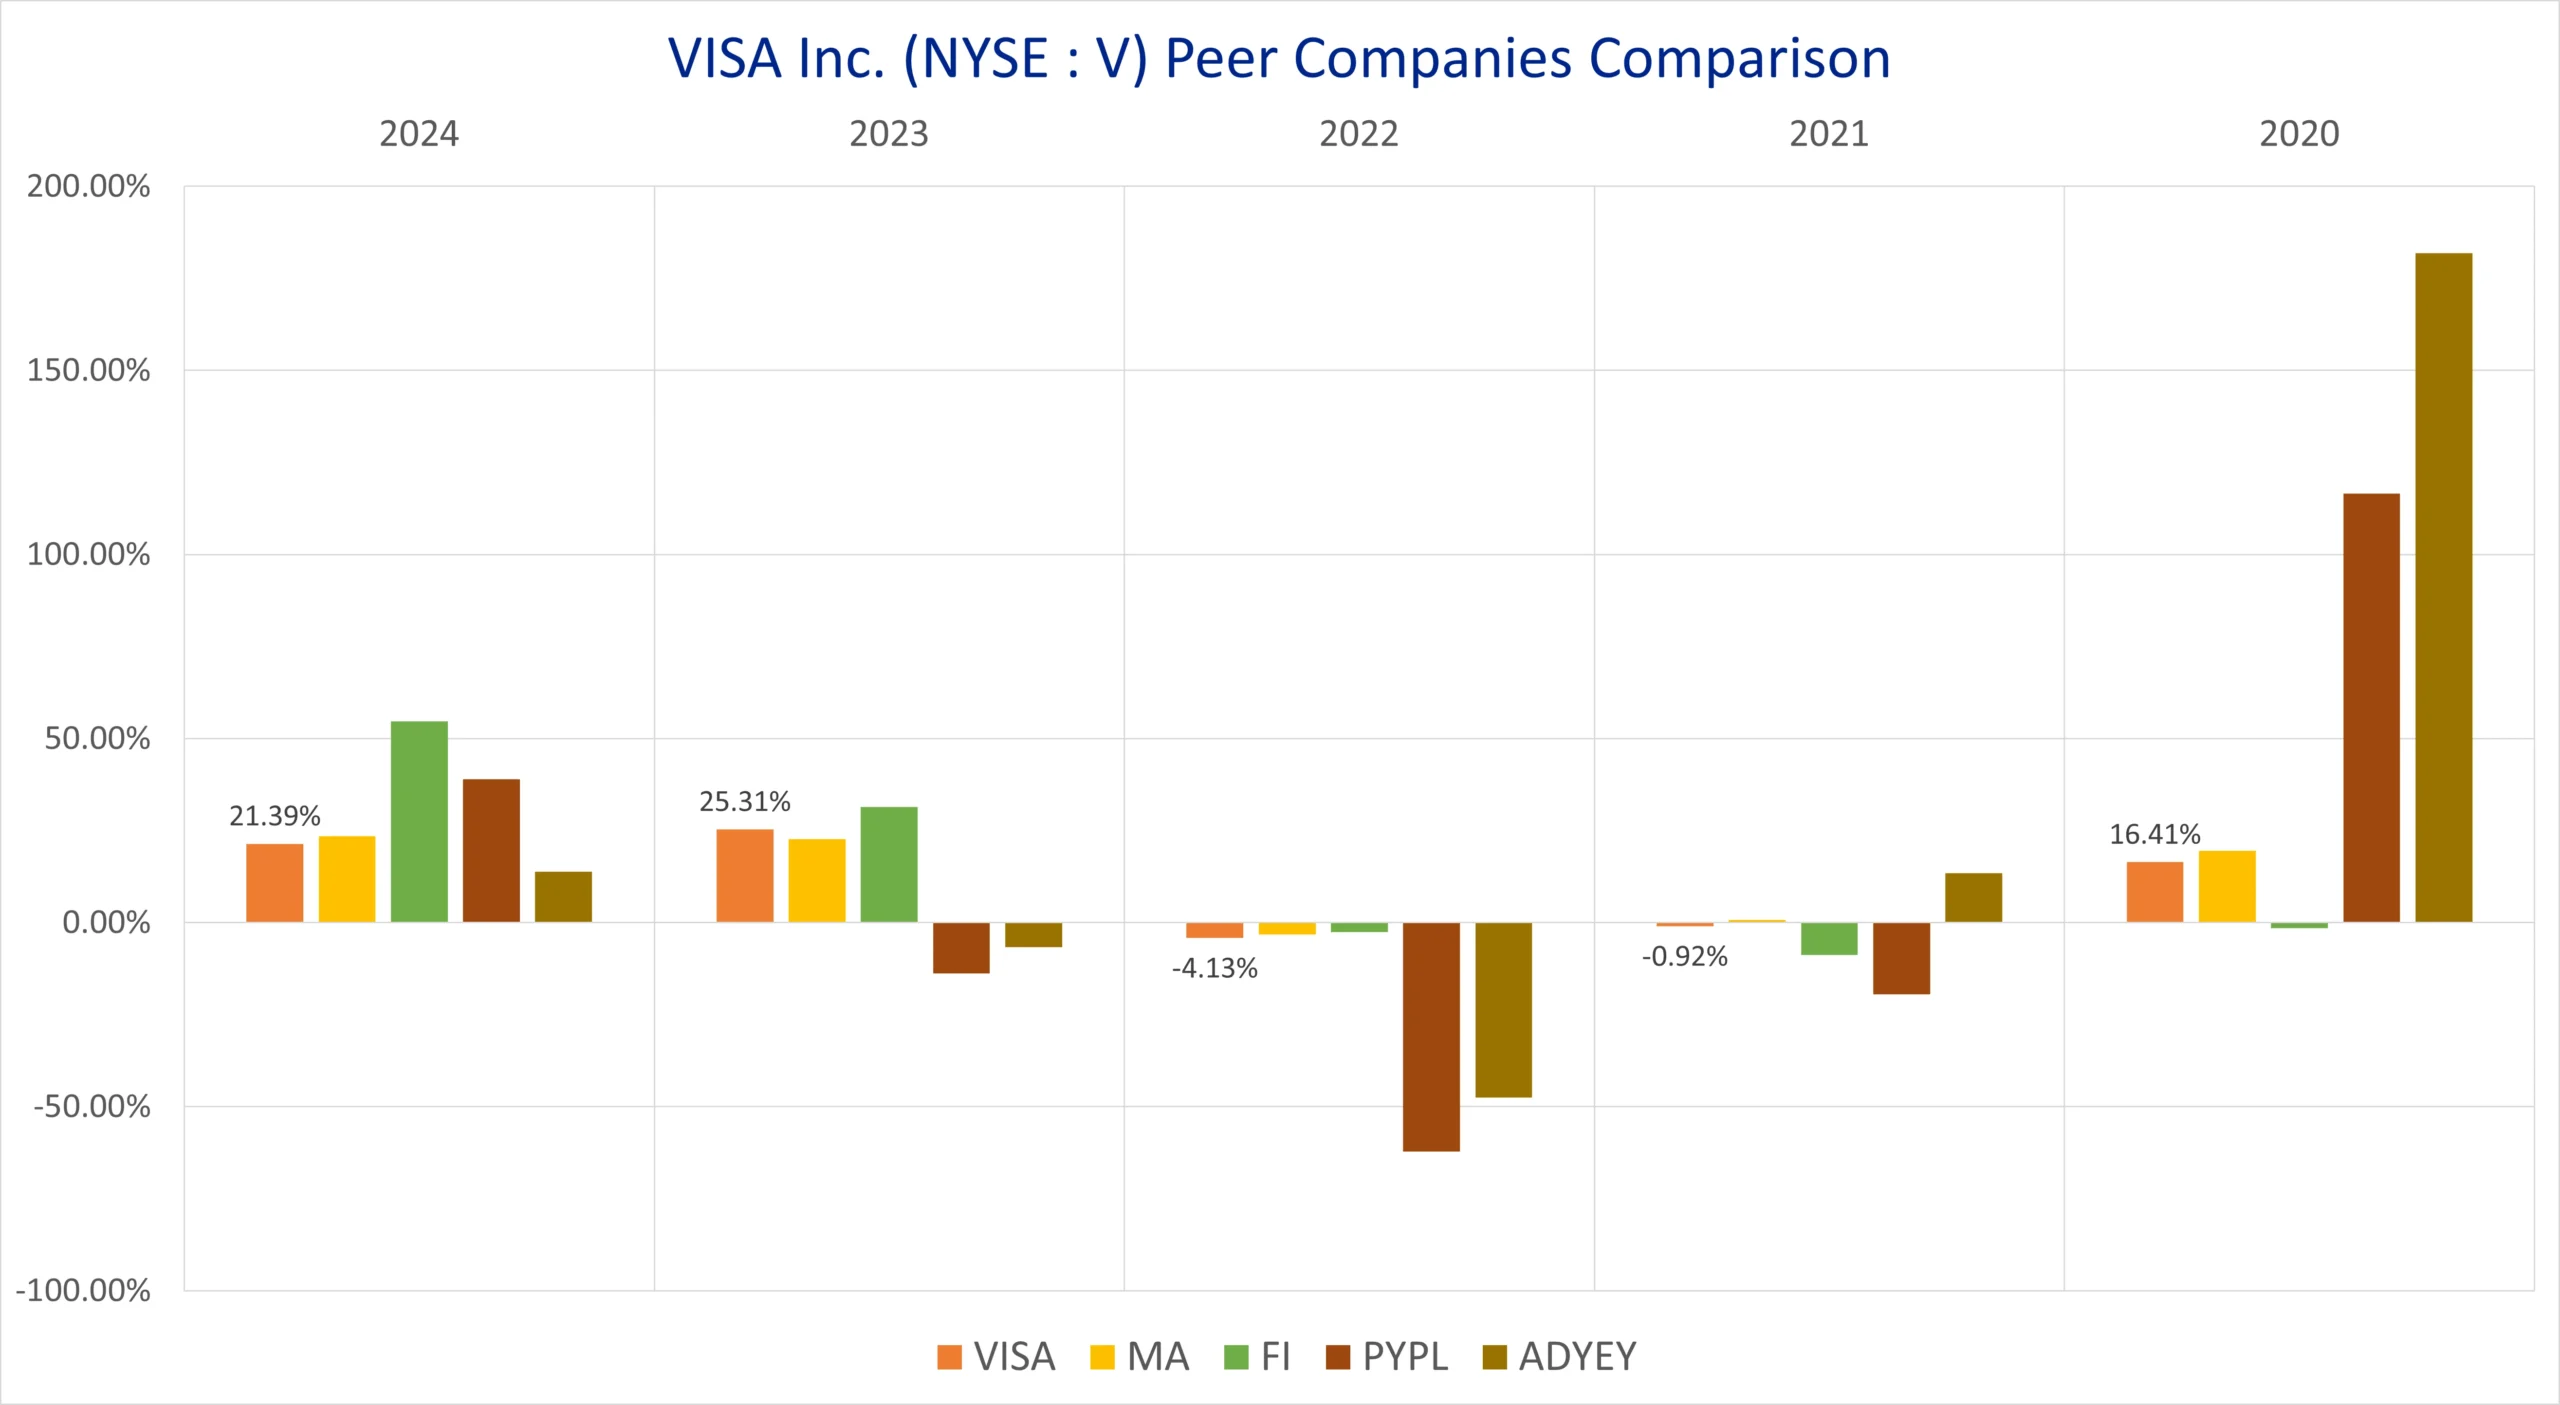
We will compare VISA, Inc. (NYSE : V) to its top competitors. We will see how its peer companies performed year-on-year. Below is the comparative table of Mastercard Incorporated (MA), Fiserv Inc. (FI), PayPal Holdings Inc. (PYPL), Adyen N.V. (ADYEY)’s returns from 2020 to 2024 based on CLOSING Prices.
| Year | VISA | MA | FI | PYPL | ADYEY |
|---|---|---|---|---|---|
| 2024 | +21.39% | +23.46% | +54.64% | +38.98% | +13.82% |
| 2023 | +25.31% | +22.66% | +31.43% | -13.77% | -6.67% |
| 2022 | -4.13% | -3.23% | -2.62% | -62.23% | -47.57% |
| 2021 | -0.92% | +0.67% | -8.84% | -19.48% | +13.45% |
| 2020 | +16.41% | +19.54% | -1.53% | +116.51% | +181.82% |
| Average Returns | +11.61% | +12.62% | +14.61% | +12.00% | +30.97% |
VISA has given a DECENT returns of +11.61% to its long-term investors if we look at the 5 years average returns.
VISA Stock Forecast : Short & Long Term
VISA Stock Forecast 2025, 2026, 2027, 2028, 2029
| Year | Stock Price Target |
|---|---|
| VISA stock forecast for 2025 | $ 353.96 |
| VISA stock forecast for 2026 | $ 396.44 |
| VISA stock forecast for 2027 | $ 444.01 |
| VISA stock forecast for 2028 | $ 497.29 |
| VISA stock forecast for 2029 | $ 556.97 |
- In 2025, we expect Visa’s stock price to reach around $353.96, representing an increase of approximately 12.03% from its 2024 closing price of $316.04.
- Looking ahead to 2026, Visa could rise to $396.44, showing a gain of about 25.39%.
- By 2027, the stock may climb to $444.01, marking an impressive increase of approximately 40.47%.
- Moving into 2028, we anticipate Visa could reach $497.29, reflecting a gain of around 57.32%.
- Finally, by 2029, Visa could hit $556.97, representing a substantial increase of approximately 76.20% from its 2024 closing price.
VISA Stock Price Forecast 2030, 2035, 2040, 2050
| Year | Stock Price Target |
|---|---|
| VISA stock forecast for 2030 | $ 623.80 |
| VISA stock forecast for 2035 | $ 1099.36 |
| VISA stock forecast for 2040 | $ 1937.45 |
| VISA stock forecast for 2045 | $ 3414.61 |
| VISA stock forecast for 2050 | $ 6017.42 |
- By 2030, our long-term analysis forecasts Visa’s stock price reaching $623.80, which would represent an increase of approximately 97.36% from its 2024 closing price of $316.04.
- Looking ahead to 2035, we estimate Visa stock could reach $1099.36, showing a remarkable return of around 247.76%.
- By 2040, the stock is expected to rise to $1937.45, reflecting a substantial gain of approximately 513.01%.
- By 2045, Visa could climb to $3414.61, marking an outstanding increase of about 980.38%.
- Further into the future, by 2050, we forecast Visa stock could hit $6017.42, indicating an impressive surge of roughly 1803.50% from its 2024 closing price.
VISA Stock Price Prediction 2025 (month-wise)
| Month | Stock Price Target |
|---|---|
| VISA stock price prediction for March 2025 | $331.09 |
| VISA stock price prediction for April 2025 | $335.11 |
| VISA stock price prediction for May 2025 | $339.74 |
| VISA stock price prediction for June 2025 | $342.61 |
| VISA stock price prediction for July 2025 | $345.34 |
| VISA stock price prediction for August 2025 | $348.29 |
| VISA stock price prediction for September 2025 | $350.08 |
| VISA stock price prediction for October 2025 | $353.96 |
| VISA stock price prediction for November 2025 | $349.13 |
| VISA stock price prediction for December 2025 | $346.47 |
As per our analysis of VISA stock price, we are expecting that the prices may rise up to $353.96, offering an approximate 12.03% return on its 2024 closing price of $316.04. This represents a DECENT return (ROI) for investors.
Also Read : Marvell Technologies | MRVL Stock Forecast 2025-2050 with detailed analysis ⚠️
Conclusion
Visa Inc (NYSE : V), founded in 1958, continues to be a dominant force in the global payments industry. With a market capitalization of $659.34 billion USD and annual revenue of $35.93 billion USD, the company remains financially robust and strategically well-positioned. Its largest institutional shareholder, The Vanguard Group, holds an estimated 8.94% stake—further signaling investor confidence.
After reaching its all-time high of $366.54 on March 03, 2025, Visa has maintained a bullish outlook since 2022 and shows a sideways to bullish trend across multiple timeframes. Closely correlated with the performance of major indices like the Dow and Nasdaq, Visa remains a solid pick for long-term investors. Based on our projections, the stock has the potential to climb as high as $6,017.42 by 2050, highlighting its continued growth prospects in the evolving digital economy.
Frequently Asked Questions (FAQs)
1) Will VISA stock price reach $500?
As per our current analysis, we could estimate that VISA stock could reach $500 in near future. Firstly, it is not so far from its current price & its all time high. We can see this price during 2028-29.
2) Is VISA a good stock to buy, sell or hold?
In our opinion, VISA is a Very Good stock to HOLD. BUT if you are looking for a fresh buy, you should wait for a fresh breakout. This stock provides lower returns but more stability to its long term investors.
3) What is the VISA stock forecast for 2030?
In 2030, we are expecting VISA stock price to reach around $623.80.
4) What is the VISA stock forecast for 2050?
During 2050, we might see VISA stock price to hit $6017.42.
5) What is the VISA stock forecast for 2025?
As per current market conditions, VISA stock price could reach up to $353.96 per share in 2025.
6) What is the VISA stock price prediction for 2026?
In 2026, we are expecting VISA stock price to reach around $396.44.
7) What is the VISA stock forecast for 2027?
In 2027, we are expecting VISA stock price to reach around $444.01.
8) What is the VISA stock price prediction for 2028?
In 2028, we are expecting VISA stock price to reach around $497.29.
9) What is the VISA stock forecast for 2029?
In 2029, we are expecting VISA stock price to reach around $556.97.
Disclaimer : Not an Investment Advice
The content shared here in “VISA Stock Forecast 2025 – 2050 with detailed analysis” is for general information only. The stock price forecasts provided here are based on current market conditions which are subject to change with respect to change in market scenario. It’s not intended as financial, investment, or professional advice. Always consult a qualified professional—whether legal, financial, or tax-related—before making any investment decisions.


Excellent post. I was checking constantly this blog and I am impressed!
Extremely useful information specifically the last part 🙂
I care for such info a lot. I was seeking this particular information for a long time.
Thank you and best of luck.
I am usually to blogging and i really admire your content. The article has actually peaks my interest. I am going to bookmark your site and preserve checking for brand spanking new information.
This is very interesting, You are a very skilled blogger. I’ve joined your feed and look forward to seeking more of your fantastic post. Also, I have shared your web site in my social networks!
Great write-up, I’m regular visitor of one’s site, maintain up the excellent operate, and It is going to be a regular visitor for a long time.
Hi! I know this is kinda off topic nevertheless I’d figured I’d ask. Would you be interested in trading links or maybe guest writing a blog article or vice-versa? My website goes over a lot of the same topics as yours and I feel we could greatly benefit from each other. If you happen to be interested feel free to send me an email. I look forward to hearing from you! Wonderful blog by the way!