🖥️ IBM Stock Forecast 2025 – 2050 with detailed analysis

➡️ 30 Seconds Summary ⬅️
International Business Machines Corporation (NYSE : IBM) remains one of the most iconic names in the global tech industry, known for its legacy in computing and its forward-looking innovations in AI, cloud services, and enterprise solutions. As markets continue to evolve, investors are increasingly curious about IBM’s long-term growth potential.
In this blog post “IBM Stock Forecast 2025 – 2050 with detailed analysis”, we provide a detailed stock forecast for IBM from 2025 to 2050, based on historical trends, financial data, and market outlooks. Whether you’re a seasoned trader or exploring new tech opportunities, this analysis offers valuable insights into where IBM stock could be headed in the decades to come. We will compare IBM’s performance with major indices as well as with its peer companies. We will also analyze IBM stock on multiple timeframe and based on this analysis, we will estimate its future value.
About IBM Corp. (NYSE : IBM)
| Company Name | International Business Machines Corporation |
| Stock Exchange | NYSE |
| Ticker Symbol | IBM |
| Sector | Technology |
| Headquarter | New York, US |
| Founded in | 1911 |
| Major Shareholder | Vanguard Fiduciary Trust Co. (~9.9%) |
| Market Cap. | $ 228.22 billion USD |
| Revenue | $ 62.74 billion USD |
| Total Assets | $ 137.21 billion USD |
| All-time HIGH price | $ 266.45 USD (March 10, 2025) |
| All-time LOW price (since 2015) | $ 86.50 USD (March 23, 2020) |
| Peer Companies | Accenture plc (ACN), Infosys Ltd. (INFY), Cognizant Technology Solutions Corp. (CTSH), Gartner Inc. (IT), Wipro Ltd. (WIT) |
Founded in 1911, IBM (International Business Machines Corporation) is a legacy technology company with over a century of innovation and leadership in the computing industry. With a current market capitalization of approximately $228.22 billion USD, IBM has evolved from hardware manufacturing to becoming a global leader in cloud computing, artificial intelligence, and enterprise solutions. Its long-standing presence and ability to adapt to emerging technologies make IBM a cornerstone in the world of information technology and a resilient player in global markets.
IBM Corporation (NYSE : IBM) | Past, Present & Future
IBM Historical price analysis
| Year | Open | High | Low | Close | % Change |
|---|---|---|---|---|---|
| 2024 | 162.83 | 239.35 | 157.89 | 219.83 | +34.41% |
| 2023 | 141.10 | 166.34 | 120.55 | 163.55 | +16.08% |
| 2022 | 134.07 | 153.21 | 115.55 | 140.89 | +5.41% |
| 2021 | 120.21 | 145.99 | 112.10 | 133.66 | +11.16% |
| 2020 | 128.95 | 151.63 | 86.50 | 120.24 | -6.09% |
In the above table, we can clearly see that IBM stock price gave mostly positive results to its investors every year. IBM stock price hit its all-time high of $266.45 on March 10, 2025.
Also Read : 🛜 Spotify Technology | SPOT Stock Forecast 2025-2050 with detailed analysis🚨
Live chart analysis for IBM Stock Price Forecast
Before we start looking at the future values of IBM Stock, have a close look at the live chart. Here, in IBM’s chart, we can observe that, IBM started its up trend since November 2023 when it broke its range of $120 – $150 in which IBM was trading since 2018. From Nov 2023 to March 2024, IBM stock traded in upward direction till $199. Then it got corrected & reached $164. After the above mentioned correction, IBM stock started its second wave of uptrend. In this wave, it reached to the height of $266.45 (March 10, 2025) from $164.
Time-Frame analysis of IBM : Daily, Weekly, Monthly, Yearly
By a technical chart analysis of Simple Moving Averages (SMAs) on different timeframes, we can observe the following –
| Time Frame | Observation |
|---|---|
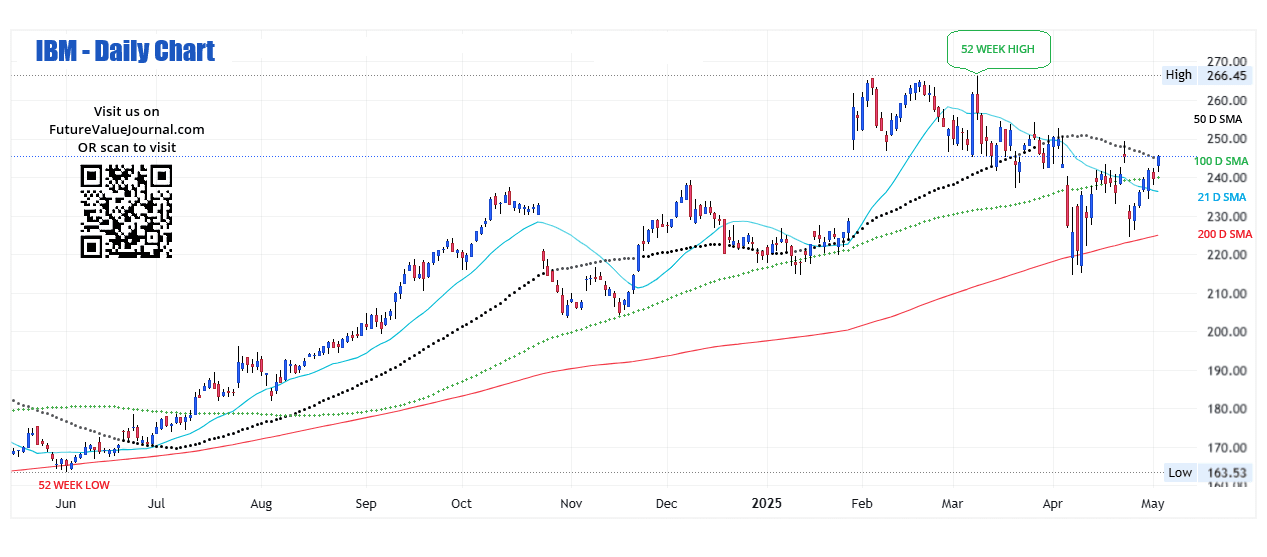 View Daily Chart (Every candle represents NYSE : IBM share’s trading session of one day. Each single candle represent the HIGH, LOW, OPEN, CLOSE of that particular day) | On the Daily time-frame IBM stock is trading ABOVE 21 Days, 50 Days, 100 Days & 200 Days SMAs. This indicates that IBM stock has a BULLISH sentiment in medium term. |
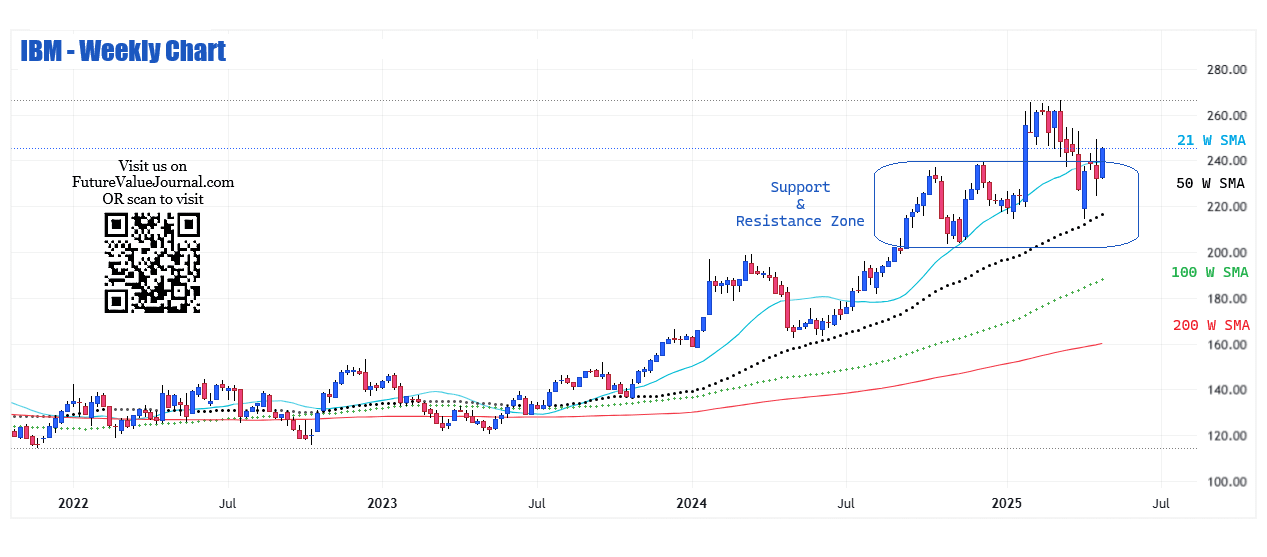 View Weekly Chart (Every candle represents NYSE : IBM share’s trading session of one week. Each single candle represent the HIGH, LOW, OPEN, CLOSE of that particular week) | On Weekly time-frame, we can observe that IBM stock is trading Above all the 21 Weeks, 50 Weeks, 100 Weeks SMA & 200 Weeks SMAs . This is the clear sign of Bullish trend in Long term. |
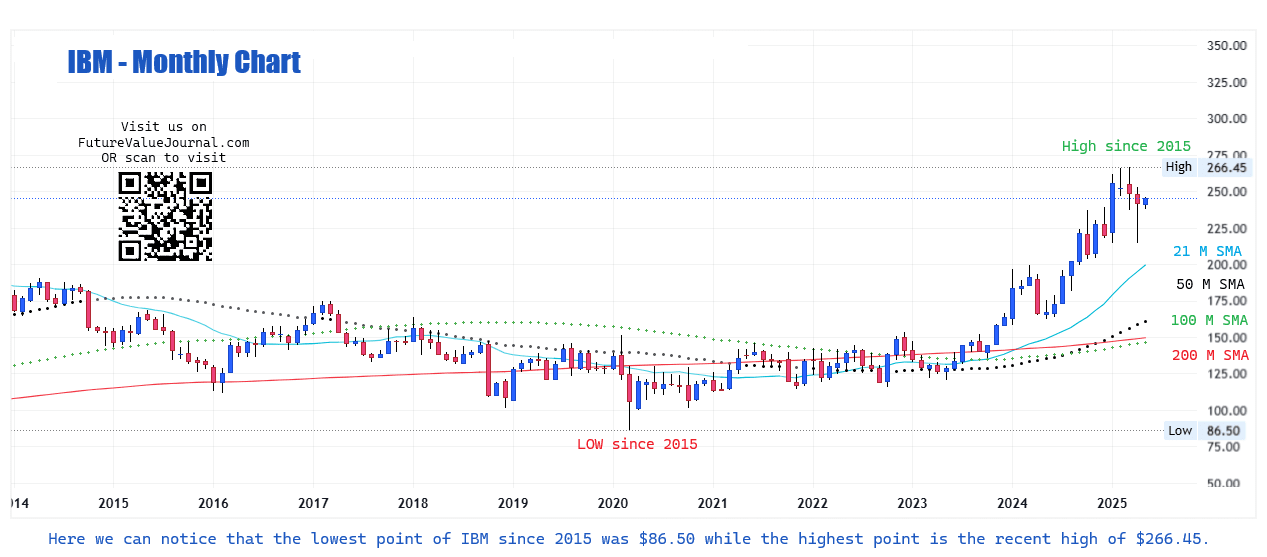 View Monthly Chart (Every candle represents NYSE : IBM stock’s trading session of one month. Each single candle represent the HIGH, LOW, OPEN, CLOSE of that particular month) | On Monthly time-frame, we can observe that IBM stock is trading Above the 21 Months, 50 Months, 100 Months & 200 Months SMAs. This indicates that the IBM stock is in Bullish trend for Very Long term. |
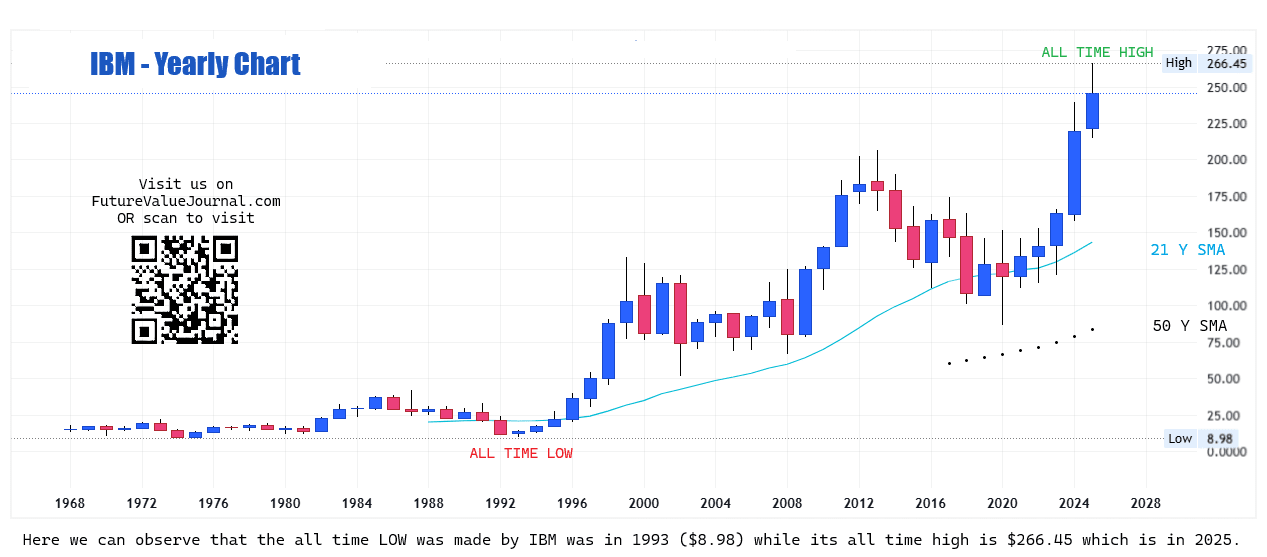 View Yearly Chart (Every candle represents NYSE : IBM stock’s trading session of one year. Each single candle represent the HIGH, LOW, OPEN, CLOSE of that particular year) | On the yearly time frame, IBM stock is trading above the 21-year SMA. While it’s difficult to make predictions based on the yearly chart, we’ve included it to give you a visual appreciation of IBM Corp.’s long-standing legacy, which dates back to 1968. |
The major support & resistance zone can be seen at the levels around $200-$240. If we go for the directional analysis of the SMAs also, we can see a clear Sideways to BULLISH trend in SMAs directions in multiple timeframes.
Dow Jones, Nasdaq & IBM : A comparative Analysis
Check out the comparative year on year returns of Dow Jones, Nasdaq and IBM. Here, we are showing the returns by comparing them on closing basis –
| Year | Dow Jones | Nasdaq | IBM |
|---|---|---|---|
| 2024 | +12.88% | +28.64% | +34.41% |
| 2023 | +13.70% | +43.42% | +16.08% |
| 2022 | -8.78% | -33.10% | +5.41% |
| 2021 | +18.73% | +21.39% | +11.16% |
| 2020 | +7.25% | +43.64% | -6.09% |
Here in the above table, we can clearly see that their is a little to NO correlation between Dow, NASDAQ & IBM stock.
Also Read : Alphabet Inc. | GOOGL Stock Forecast 2025-2050 with detailed analysis 📌
IBM Peer Comparison / Competitors Analysis
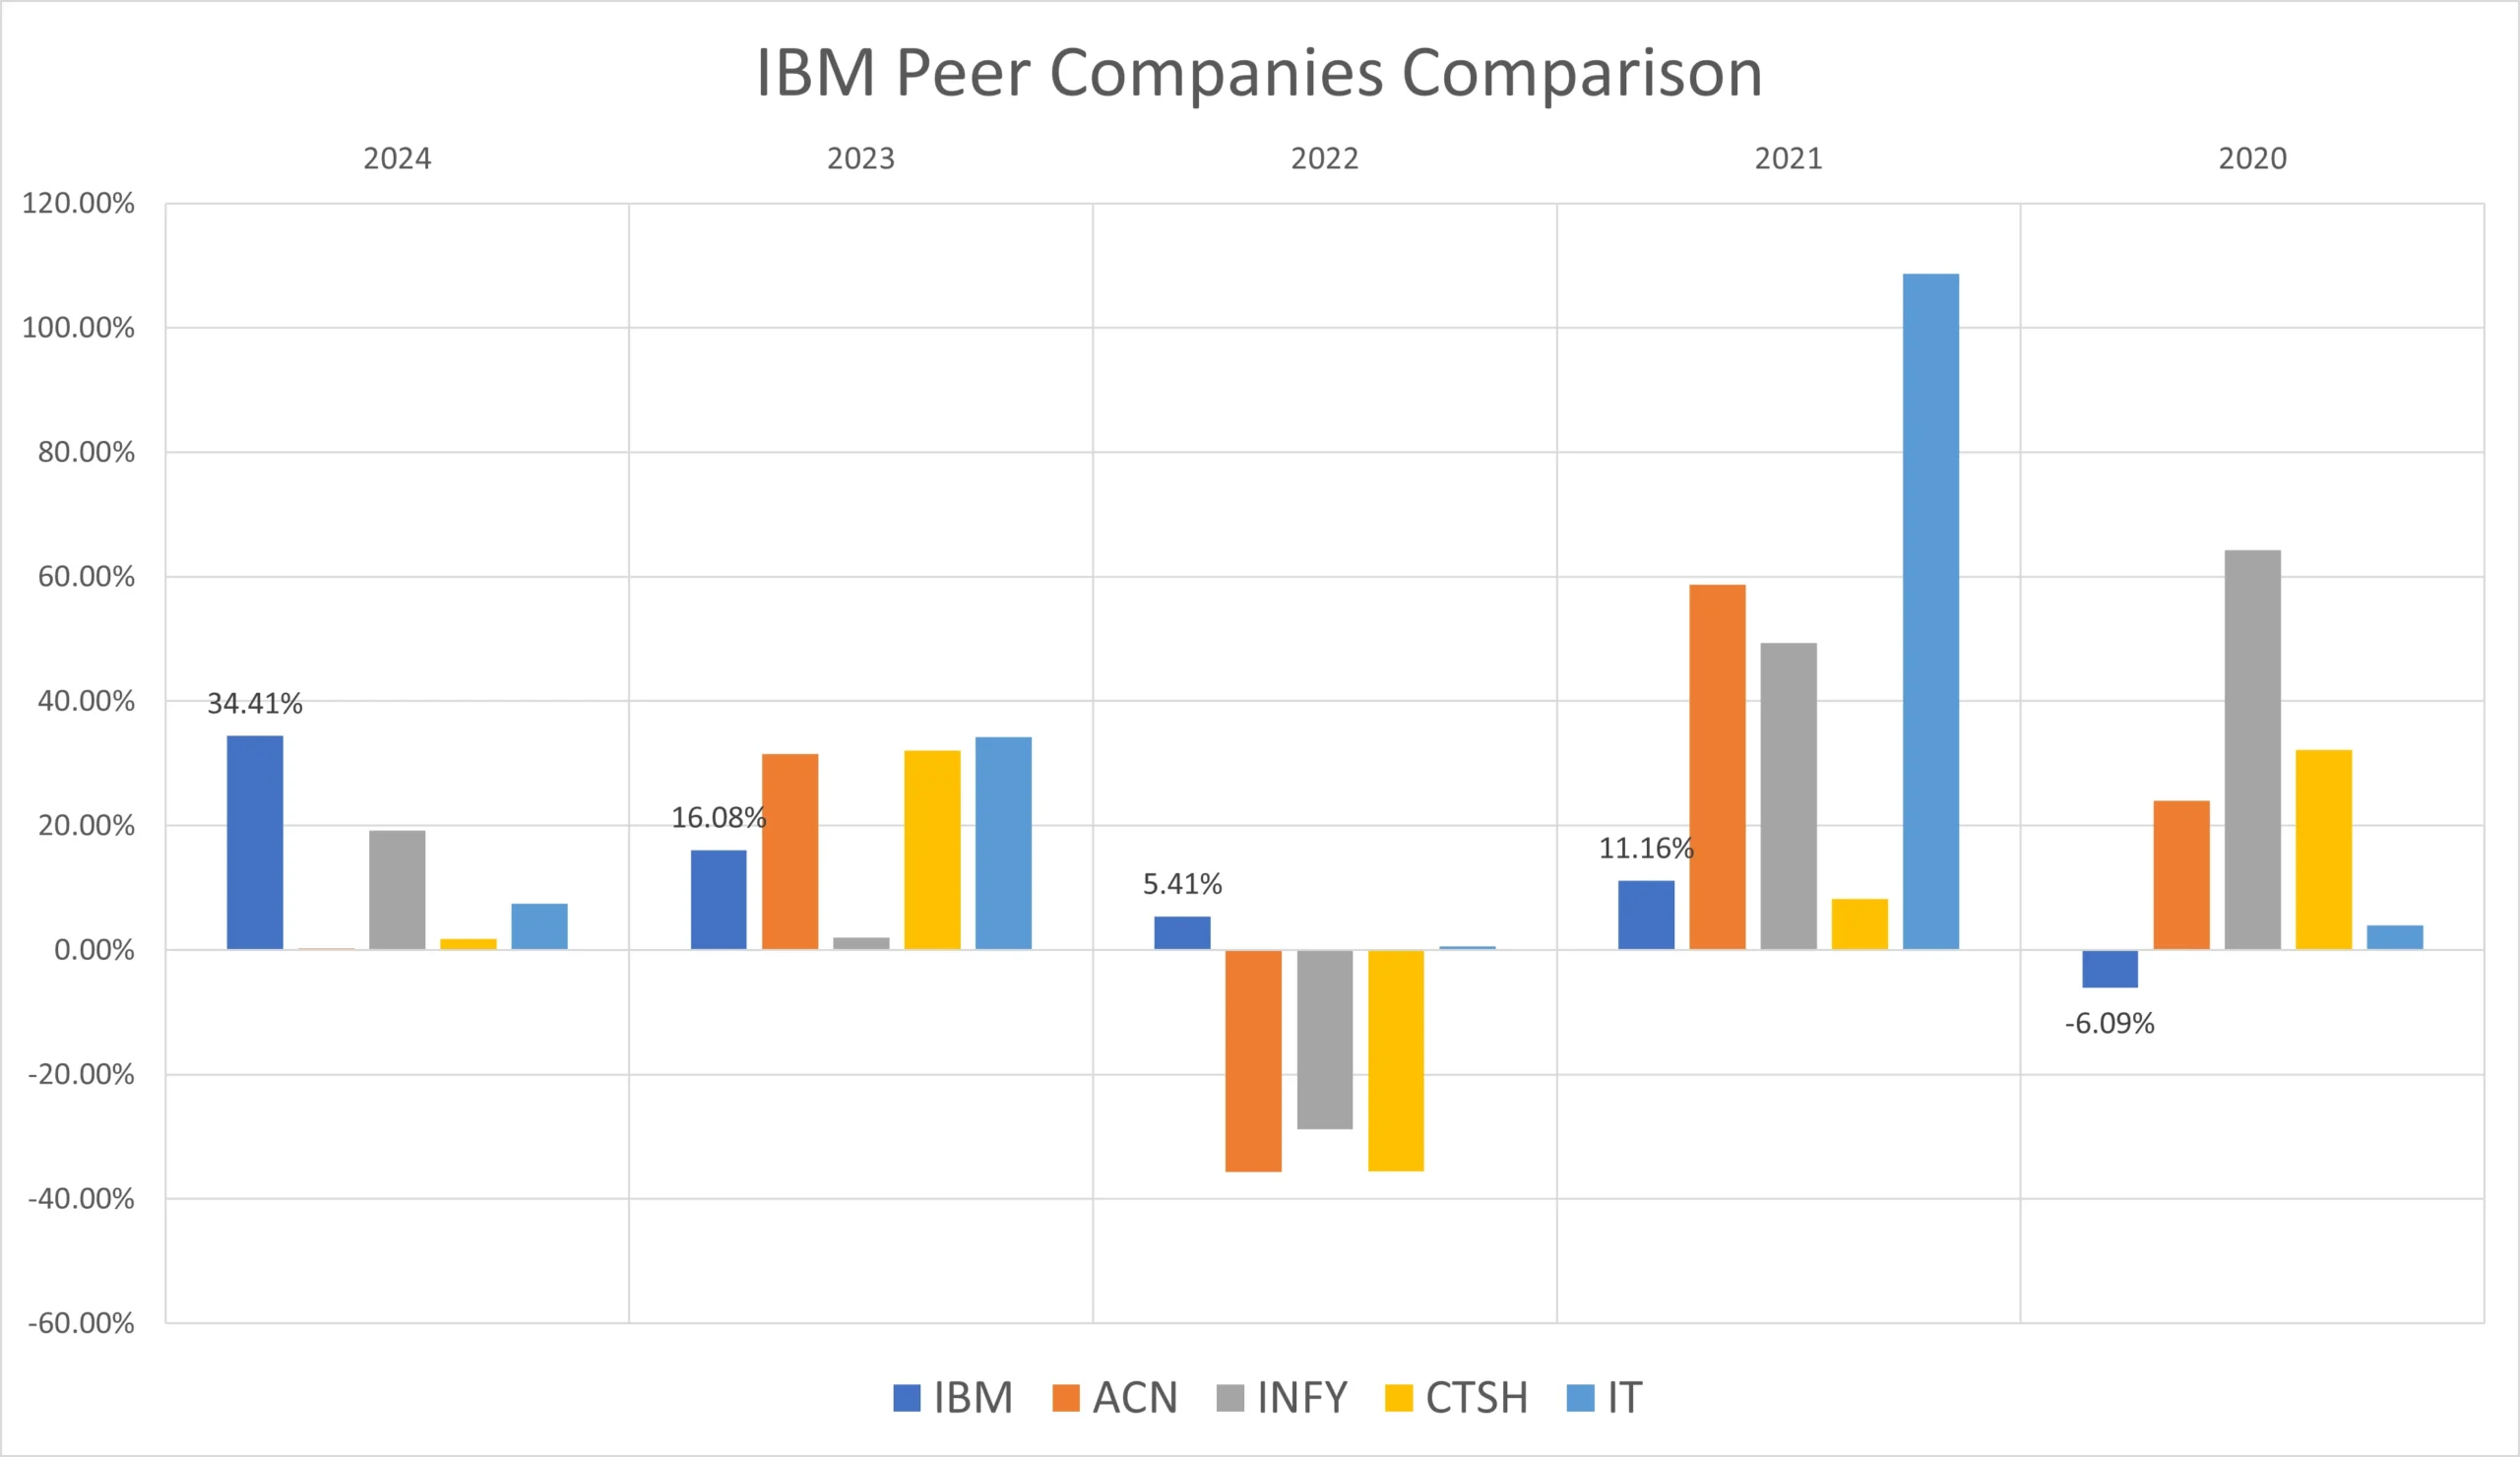
We will compare IBM Corp. (NYSE : IBM) to its peer companies. We will see how its top competitors performed year-on-year . Below is the comparative table of Accenture plc (ACN), Infosys Ltd. (INFY), Cognizant Technology Solutions Corp. (CTSH), Gartner Inc. (IT)’s returns from 2020 to 2024 based on CLOSING Prices.
| Year | IBM | ACN | INFY | CTSH | IT |
|---|---|---|---|---|---|
| 2024 | +34.41% | +0.25% | +19.26% | +1.81% | +7.40% |
| 2023 | +16.08% | +31.51% | +2.05% | +32.07% | +34.20% |
| 2022 | +5.41% | -35.63% | -28.84% | -35.54% | +0.54% |
| 2021 | +11.16% | +58.70% | +49.32% | +8.26% | +108.70% |
| 2020 | -6.09% | +24.05% | +64.24% | +32.13% | +3.95% |
| Average Returns | +12.19% | +15.78% | +21.20% | +7.75% | +30.95% |
IBM has given a positive returns of +12.19% to its long-term investors if we look at the 5 years average returns. This return seems negligible if we take inflation into account.
IBM Stock Forecast : Short & Long Term
IBM Stock Forecast 2025, 2026, 2027, 2028, 2029
| Year | Stock Price Target |
|---|---|
| IBM stock forecast for 2025 | $ 263.79 |
| IBM stock forecast for 2026 | $ 303.36 |
| IBM stock forecast for 2027 | $ 348.87 |
| IBM stock forecast for 2028 | $ 401.20 |
| IBM stock forecast for 2029 | $ 461.38 |
- In 2025, we expect IBM’s stock price to reach around $263.79, representing an increase of approximately 19.99% from its 2024 closing price of $219.83.
- Looking ahead to 2026, IBM could rise to $303.36, showing a gain of about 37.96%.
- By 2027, the stock may climb to $348.87, marking an impressive 58.65% increase.
- Moving into 2028, we anticipate IBM could reach $401.20, reflecting a gain of around 82.48%.
- Finally, by 2029, IBM could hit $461.38, representing a substantial 109.86% increase from its 2024 closing price.
IBM Stock Forecast 2030, 2035, 2040, 2050
| Year | Stock Price Target |
|---|---|
| IBM stock forecast for 2030 | $ 530.58 |
| IBM stock forecast for 2035 | $ 935.07 |
| IBM stock forecast for 2040 | $ 1647.92 |
| IBM stock forecast for 2045 | $ 2593.04 |
| IBM stock forecast for 2050 | $ 5118.20 |
- By 2030, our long-term analysis forecasts IBM’s stock price reaching $530.58, which would represent an increase of approximately 141.38% from its 2024 closing price of $219.83.
- Looking ahead to 2035, we estimate IBM stock could reach $935.07, showing a remarkable 325.36% return.
- By 2040, the stock is expected to rise to $1647.92, reflecting a substantial 649.56% gain.
- By 2045, IBM could climb to $2593.04, marking an outstanding 1079.57% increase.
- Further into the future, by 2050, we forecast IBM stock could hit $5118.20, indicating an impressive 2228.33% increase from its 2024 closing price of $219.83.
IBM Stock Price Prediction 2025 (month-wise)
| Month | Stock Price Target |
|---|---|
| IBM stock price prediction for March 2025 | $225.18 |
| IBM stock price prediction for April 2025 | $231.38 |
| IBM stock price prediction for May 2025 | $239.19 |
| IBM stock price prediction for June 2025 | $247.07 |
| IBM stock price prediction for July 2025 | $263.79 |
| IBM stock price prediction for August 2025 | $251.34 |
| IBM stock price prediction for September 2025 | $246.81 |
| IBM stock price prediction for October 2025 | $238.52 |
| IBM stock price prediction for November 2025 | $245.93 |
| IBM stock price prediction for December 2025 | $251.04 |
As per our analysis of IBM stock price, we are expecting that the prices may rise up to $263.79, offering an approximate 20% return on its 2024 closing price of $219.83. This represents a DECENT return (ROI) for investors.
Also Read : Will your favorite payment corp. ‘VISA’ is a profitable investment in coming year? Lets find out.
Conclusion
In conclusion, International Business Machines Corporation (NYSE : IBM), founded in 1911, stands as one of the oldest and most respected technology corporations in the world. With a robust market capitalization of $228.22 billion USD and annual revenue of $62.74 billion USD, IBM continues to evolve and innovate. The company’s major shareholder, Vanguard Fiduciary Trust, holds approximately 9.9% ownership, signaling strong institutional confidence.
Technically, IBM has maintained a BULLISH trend across multiple timeframes when analyzed using various SMA combinations. The stock has delivered an average return of 12.19% over the past five years and recently reached an all-time high of $266.45 in March 2025. Looking ahead, our long-term projections indicate that IBM’s stock could potentially rise to $5,118.20 by 2050, making it a promising candidate for long-term investors seeking steady growth and technological resilience.
Frequently Asked Questions (FAQs)
1) Will IBM stock price reach $500?
As per our current analysis, we can expect the $500 per share price of IBM during 2029-2030.
2) Is IBM a good stock to buy, sell or hold?
In our opinion, IBM (Big Blue) is a good stock to HOLD if you are a patient investor. BUT if are someone who is looking for quick returns, we will suggest you to reconsider IBM for fresh buying.
3) What is the IBM stock forecast for 2030?
In 2030, we are expecting IBM stock price to reach around $530.58.
4) What is the IBM stock forecast for 2050?
During 2050, we might see IBM stock price to hit $5118.20.
5) What is the IBM stock forecast for 2025?
As per current market conditions, IBM stock price could reach up to $263.79 per share in 2025.
6) What is the IBM stock price prediction for 2026?
In 2026, we are expecting IBM stock price to reach around $303.36.
7) What is the IBM stock forecast for 2027?
In 2027, we are expecting IBM stock price to reach around $348.87.
8) What is the IBM stock price prediction for 2028?
In 2028, we are expecting IBM stock price to reach around $401.20.
9) What is the IBM stock forecast for 2029?
In 2029, we are expecting IBM stock price to reach around $461.38.
10) What is the IBM stock price prediction for 2040?
In 2040, we are expecting IBM stock price to reach around $1647.92.
11) What is the IBM stock price prediction for 2045?
In 2045, we are expecting IBM stock price to reach around $2593.04.
Disclaimer : Not an Investment Advice
The content shared here in “🖥️ IBM Stock Forecast 2025 – 2050 with detailed analysis” is for general information only. The stock price forecasts provided here are based on current market conditions which are subject to change with respect to change in market scenario. It’s not intended as financial, investment, or professional advice. Always consult a qualified professional—whether legal, financial, or tax-related—before making any investment decisions.


so much wonderful info on here, : D.
Wonderful goods from you, man. I’ve understand your stuff previous to and you’re just extremely wonderful. I actually like what you have acquired here, really like what you are stating and the way in which you say it. You make it entertaining and you still care for to keep it smart. I can’t wait to read far more from you. This is actually a great site.
This website is my breathing in, real fantastic design and perfect content.
Definitely imagine that that you said. Your favorite reason appeared to be on the web the simplest factor to take note of. I say to you, I definitely get irked even as other folks consider worries that they just do not recognise about. You controlled to hit the nail upon the highest and outlined out the whole thing without having side effect , other folks could take a signal. Will likely be again to get more. Thanks