🚀 Vistra Corp. | VST stock forecast 2025, 2030 and beyond
👉 30 Seconds Summary 👈
Vistra Corp. stands as a key player in the energy industry, and its stock shows solid potential for steady, long-term growth. Our analysis suggests that VST stock price could reach $175.11 in 2025, $389.78 by 2030, rise to $431.54 by 2035, climb to $462.07 by 2040, and eventually hit $498.01 by 2050. Although the growth may be gradual, Vistra’s strong foundation and focus on innovation point to a bright future for investors looking for long-term returns.
Welcome to our article on “VST stock forecast for 2025, 2030 and beyond“. If you’re an investor or someone interested in the energy sector stocks, you might be wondering where Vistra Corp. is headed in the upcoming years. As a key player in the energy industry, VST stock prices gets influenced by various factors, including market trends, technological innovations, and changes in the energy landscape. In this post, we’ll explore VST’s stock potential. We’ll break down what analysts expect based on the company’s financial performance, industry trends, and broader economic conditions. Whether you’re considering buying, holding, or selling VST stock, this forecast aims to provide you a clearer picture of what the future might hold.
About Vistra Corporation (NYSE: VST)
| Company Name | Vistra Corporation |
| Stock Exchange | NYSE |
| Ticker Symbol | VST |
| Sector | Energy & Power Generation |
| Headquarter | Irving, Texas |
| Founded in | 2016 |
| Major Shareholder | Vanguard Group (>12%) |
| Market Cap. | $ 43.04 billion usd |
| Revenue(2023) | $ 14.08 billion usd |
| Total Assets | $ 39.12 billion usd |
| All-time high closing price | $ 199.84 usd (Jan 23, 2025) |
| 52-week low | $ 64.26 usd (April 19, 2024) |
| 52-week high | $ 199.84 usd (Jan 23, 2025) |
Vistra Corp. is the largest competitive power generator in the U.S., with a generation capacity of around 41,000 megawatts which enables them to power approx 20 million homes. The company operates in all major competitive markets across the country and plays a key role in the energy sector’s transformation. Vistra is delivering affordable, and sustainable energy, backed by a diverse portfolio of natural gas, nuclear, coal, solar, and battery energy storage facilities.
Vistra is a leader in expanding zero-carbon resources, it operates the second-largest fleet of competitive nuclear power plants in the U.S., alongside significant battery energy storage capabilities and a growing number of solar energy projects. Vistra is also one of the largest competitive electricity providers, offering innovative and customer-centric solutions to meet the expanding needs of its approx. 5 million customers.
Vistra Corp. (VST) Share Price Analysis | Past, Present & Future
By analyzing both technical charts and fundamental data, we’ll help you understand what might drive VST stock price in the near and long term future. So, if you’re curious about VST’s growth potential, keep reading to learn more about where this stock could reach.
VST Historical price data [2018 – 2024]
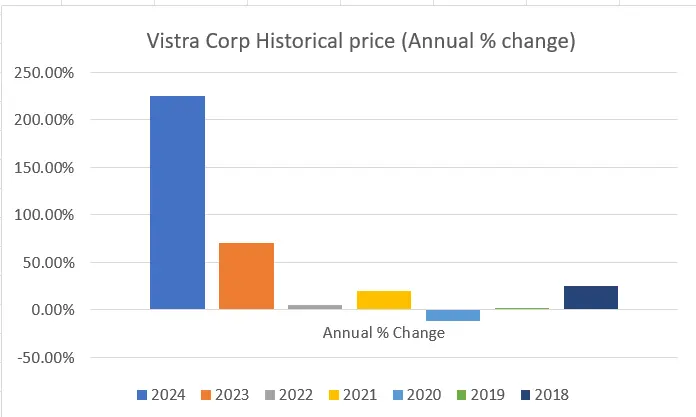
Since 2018, we can see that VST stock price gave a almost No returns to its initial investors but in 2023, it gave a return of more than 50% as compared to its previous year price. In 2024, it gave a whooping 200+% return to its investors, which no one expected from an energy sector company.
Also Read : Serve Robotics (SERV) stock forecast for 2025 and more…
One year chart analysis for VST stock forecast 2025
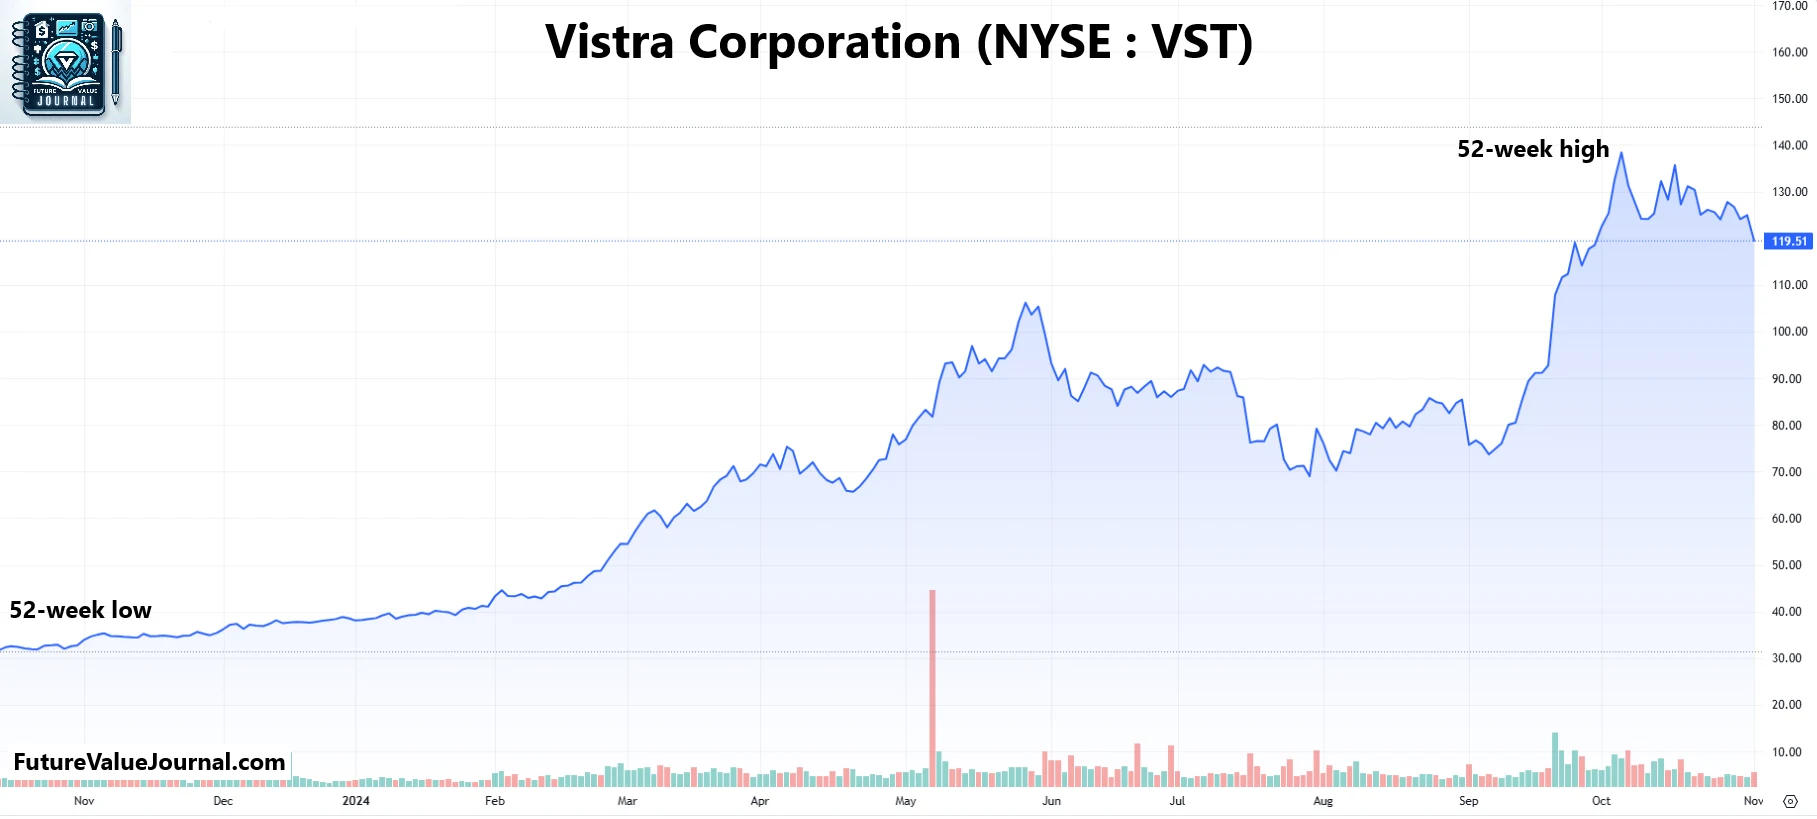
Here, in VST one year chart, we can interpret that the stock remained below $30 since launch but in Aug 2023 VST stock price broke its range and started moving up. In 2024, it reached to $75.89 on April 01,2024 to came back to $64. But It again started a rally and touched a high of $107.24. From their, VST stock price came down and took support near $64 again, ranged for few days and sky-rocketed to its High of $143.87 on Oct 07,2024. On the basis of that moves and VST’s fundamentals, we prepared monthly VST stock forecast for 2025.
VST Stock Live Chart
Time-Frame analysis of VST : Hourly, Daily & Weekly
By analyzing a VST share price through a timeframe chart, we can gather some key insights that will assist us in determining the final VST share price prediction : –
Time Frame | Observation |
|---|---|
 (Every candle represents NASDAQ : VST share’s trading session of one hour. Each single candle represent the HIGH, LOW, OPEN, CLOSE of that particular hour) | On hourly time-frame, we can observe that VST share is trading near to the 21 hour, 50 hour, 100 hour and 200 hour SMA. This indicates that the VST share price is in Sideways trend for short term. |
 (Every candle represents NASDAQ : VST share’s trading session of one day. Each single candle represent the HIGH, LOW, OPEN, CLOSE of that particular day) | On daily time-frame, we can observe that VST share is trading BELOW 21 Day SMA but above 50 Day, 100 Day & 200 Day SMA. This is the sign of slight Bearishness but Strong Bullishness in medium term. |
 (Every candle represents NASDAQ : VST stock’s trading session of one week. Each single candle represent the HIGH, LOW, OPEN, CLOSE of that particular week) | On the weekly time-frame VST share is trading above 21 weeks, 50 weeks, 100 weeks & 200 weeks. This indicates that VST share has a clear Bullish sentiment, if we look at it from a very long term perspective. |
Since there is a POSITIVE perspective shown by SMAs at Daily & Weekly time-frame while a NEGATIVE perspective in Hourly time-frames. This can be a little confusing for a trader. So, lets analyze it more deeply. By observing the directions of the SMAs, we can find that VST’s direction is always POSITIVE in Weekly & Daily time-frame while NEUTRAL in Hourly Timeframe. If you are a Long term investor, this is a sign of your waiting time, if you are thinking of investing in VST stocks.
Dow Jones, NASDAQ & VST : A comparative Analysis
Check out the comparative year on year returns of Dow Jones, Nasdaq and VST. Here, we are showing the returns by comparing them on closing basis –
| Year | Dow Jones | Nasdaq | VST |
|---|---|---|---|
| 2024 | +12.88% | +28.64% | +257.92% |
| 2023 | +13.70% | +43.42% | +66.03% |
| 2022 | -8.78% | -33.10% | +1.89% |
| 2021 | +18.73% | +21.39% | +15.82% |
| 2020 | +7.25% | +43.64% | -14.48% |
Also Read : CrowdStrike | CRWD Stock Price Prediction 2025, 2030, 2040, 2050
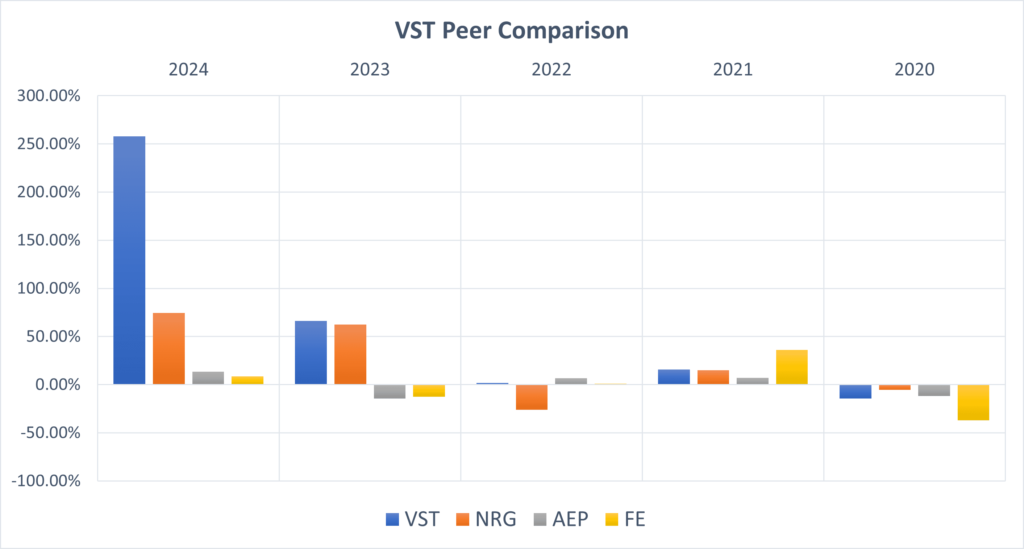
VST Peer Comparison / Competitors Analysis
We will compare Vistra Corp. (NYSE : VST)to its top competitors. We will see how its peer companies performed year-on-year . Below is the comparative table of NRG Energy Inc (NRG), American Electric Power Co. Inc. (AEP) & FirstEnergy Corp. (FE)’s returns from 2020 to 2024 based on CLOSING Prices.
| Year | VST | NRG | AEP | FE |
|---|---|---|---|---|
| 2024 | +257.92% | +74.51% | +13.56% | +8.51% |
| 2023 | +66.03% | +62.48% | -14.46% | -12.59% |
| 2022 | +1.89% | -26.14% | +6.72% | +0.84% |
| 2021 | +15.82% | +14.73% | +6.85% | +35.87% |
| 2020 | -14.48% | -5.53% | -11.89% | -37.02% |
| Average Returns | +65.43% | +24.01% | +0.15% | -0.87% |
Here we can observe that VST’s performance is really commendable when compared to its peer companies if we look at the 5-year average returns.
VST stock forecast : Short & Long Term
VST stock forecast 2025, 2026, 2027, 2028, 2029
| Year | Stock Price Target |
|---|---|
| 2025 | $ 175.11 |
| 2026 | $ 203.42 |
| 2027 | $ 257.36 |
| 2028 | $ 319.74 |
| 2029 | $ 362.86 |
Here are the percentage gains for VST stock price based on the above predictions:
- By 2025, we expect VST stock price to reach $175.11, representing a 39.76% gain from its current price of $125.29.
- By 2026, the stock could rise to $203.42, reflecting a 62.36% increase.
- By 2027, we anticipate it climbing to $257.36, marking a 105.41% gain.
- By 2028, VST stock price could reach $319.74, showing a 155.20% increase.
- Finally, by 2029, we project it to hit $362.86, representing a substantial 189.62% gain from today’s price.
VST stock forecast 2030, 2035, 2040, 2050
| Year | Stock Price Target |
|---|---|
| 2030 | $ 389.78 |
| 2035 | $ 431.54 |
| 2040 | $ 462.07 |
| 2050 | $ 498.01 |
Here are the percentage gains for VST stock price based on the above predictions:
- By 2030, we expect VST stock price to reach $389.78, representing a 211.10% increase from its current price of $125.29.
- By 2035, the stock could rise to $431.54, reflecting a 244.43% return.
- By 2040, we expect the stock to climb to $462.07, marking a 268.80% gain.
- Finally, by 2050, VST stock price could hit $498.01, indicating an impressive 297.49% increase from today’s price.
VST stock forecast 2025 (month-wise)
| Month | Stock Price Target |
|---|---|
| January 2025 | 136.13 |
| February 2025 | 139.74 |
| March 2025 | 150.53 |
| April 2025 | 158.51 |
| May 2025 | 162.40 |
| June 2025 | 168.84 |
| July 2025 | 169.04 |
| August 2025 | 171.48 |
| September 2025 | 175.11 |
| October 2025 | 174.23 |
| November 2025 | 170.01 |
| December 2025 | 169.94 |
As per our analysis of VST stock price, we are expecting that the prices may rise up to $175.11, offering an approximate 39.76% return on its current price of $125.29 as of November 07, 2024. This represents a decent return (ROI) for investors. Starting in early 2025, we anticipate a gradual and steady rise in VST stock price. However, by August to October 2025, we might see the stock to hit its peak, which aligns with patterns observed in previous charts. After October, we can see some decline in prices.
Also Read : Laser Photonics (LASE) stock forecast for 2025 – 2050
Conclusion
In conclusion, Vistra Corp (NYSE : VST) is a strong energy sector company with a market capitalization of $43.04 billion USD and revenue of $14.08 billion USD. Over the past five years, it has delivered an impressive average return of 65.43% to its investors, making it an attractive investment option.
The stock has recorded an all-time high of $199.84 USD per share, and with the rising demand for electricity, its future looks promising. If this trend continues, Vistra Corp’s stock could reach new heights in the coming years. Overall, it has the potential to be a strong growth stock for long-term investors. ⚡
Also Read : AVGO stock price forecast for 2025 and more…
Frequently Asked Questions (FAQs)
1) Will VST stock price reach $500?
Yes, VST stock price could reach to $500 till 2050.
2) Is Vistra a good stock to buy, sell or hold?
In our opinion, If you believe slow and steady growth, then VST can be a good choice for you. We all know that energy consumption is going to increase in coming years and the demand for energy production will increase with it. So if you can hold this stock for a longer term, it can become a multi-bagger for you.
3) What is the VST stock forecast for 2030?
In 2030, we are expecting VST stock price to reach around $390.
4) What is the VST stock forecast for 2050?
During 2050, we can see VST stock price to hit more than $498.It can worth even more if it continues to innovate new tech in energy sector.
5) Is Vistra Corp. a long term investment?
In our opinion, Yes, it can be long term investment. Energy sector takes time to grow. It can take years to set up a new power generation plant or to develop a new method of power generation. But, if you can buy right and sight tight, you can get good return in coming years.
6) What is the price target for VST in 2025?
In 2025, we are expecting VST stock price to reach around $175.
7) Is Vistra a Fortune 500 company?
Vistra is a top Fortune 500 company that specializes in retail electricity and power generation, supplying essential energy to customers, businesses, and communities across the country.
8) Who owns Vistra Corp.?
Top three shareholders of Vistra Corp are Vanguard Group Inc. (12%) , FMR Llc. (7.26%) and BlackRock Inc (5.67%).
9) Is Vistra Corp public?
Yes, Vistra Corp is traded on NYSE under the ticker “VST”.
Disclaimer : Not an Investment Advice
The content shared in”🚀 Vistra Corp. | VST stock forecast 2025, 2030 and beyond” is for general information only. It’s not intended as financial, investment, or professional advice. Always consult a qualified professional—whether legal, financial, or tax-related—before making any investment decisions.


There’s something very grounding about your blog. It’s become a space I return to for clarity and calm.
Thank you so much for your thoughtful comment. We’re truly touched to know that our blog brings you a sense of clarity and calm. It means a great deal to us.
My brother suggested I might like this web site. He was totally right.
This post truly made my day. You can not imagine just how much time I had spent for this info!
Thanks!
You are a very clever person!
Very nice post. I just stumbled upon your weblog and wished to say that I have really enjoyed surfing around your blog posts. After all I’ll be subscribing to your rss feed and I hope you write again soon!
Hiya very cool blog!! Man .. Beautiful .. Wonderful .. I will bookmark your web site and take the feeds additionally…I am glad to find so many helpful info right here in the submit, we need work out more strategies in this regard, thanks for sharing. . . . . .
Hmm it looks like your blog ate my first comment (it was super long) so I guess I’ll just sum it up what I wrote and say, I’m thoroughly enjoying your blog. I as well am an aspiring blog writer but I’m still new to everything. Do you have any tips and hints for beginner blog writers? I’d genuinely appreciate it.