💳 AXP | American Express Stock Forecast 2025-2050 with Complete Analysis

➡️ 30 Seconds Summary ⬅️
Are you curious about the future of American Express (NYSE: AXP)? In this detailed “AXP | American Express Stock Forecast 2025-2050 with Complete Analysis” blogpost, we’ll explore AXP’s stock performance outlook from 2025 to 2050, backed by market trends, historical data, and expert insights. As a global leader in financial services and digital payments, American Express continues to attract long-term investors looking for both stability and growth.
Whether you’re an existing shareholder or considering adding AXP to your portfolio, this analysis will help you understand the stock’s long-term potential, key growth drivers, and projected share price targets for the decades ahead. We will also compare AXP’s performance with major indices (Dow & Nasdaq) as well as with its peer companies. We will also analyze AXP stock price on multiple timeframe and based on this detailed analysis, we will estimate its future stock prices which will help you in taking precise investment decision.
About American Express Company (NYSE : AXP)
| Company Name | American Express Company |
| Stock Exchange | NYSE |
| Ticker Symbol | AXP |
| Sector | Financial Services |
| Headquarter | New York, US |
| Founded in | 1850 |
| Major Shareholder | Berkshire Hathaway Inc. (~21.5%) |
| Market Cap. | $ 176.21 billion USD |
| Revenue(2024) | $ 62.95 billion USD |
| Total Assets | $ 271.50 billion USD |
| All-time HIGH price | $ 326.27 USD (Jan. 23, 2025) |
| All-time LOW price (since 2015) | $ 50.27 USD (Feb 11, 2016) |
| Peer Companies | Capital One Financial Corporation (COF), Discover Financial Services (DFS), Synchrony Financial (SYF), SoFi Technologies Inc. (SOFI), Joint Stock Company Kaspi.kz (KSPI) |
Founded in 1850, American Express (NYSE: AXP) is a legacy financial powerhouse with over 170 years of experience in the global payments and credit card industry. As one of the most trusted brands in the sector, AXP boasts a robust financial foundation, with a 2024 revenue of $62.92 billion USD. A key confidence booster for many investors is the company’s major stakeholder—Berkshire Hathaway, led by Warren Buffett. The stock has demonstrated significant volatility and potential over time, reaching an all-time high of $326.27. This blog dives deep into American Express stock forecasts from 2025 to 2050, offering insight into where AMEX might be headed for long-term investors.
American Express Company (NYSE : AXP) | Past, Present & Future
American Express Company (AXP) | Historical price analysis
| Year | Open | High | Low | Close | % Change |
|---|---|---|---|---|---|
| 2024 | 186.49 | 307.82 | 177.81 | 296.79 | +58.42% |
| 2023 | 149.54 | 188.30 | 140.91 | 187.34 | +26.80% |
| 2022 | 164.51 | 199.55 | 130.65 | 147.75 | -9.69% |
| 2021 | 121.30 | 189.03 | 112.10 | 163.60 | +35.31% |
| 2020 | 124.66 | 138.13 | 67.00 | 120.91 | -2.88% |
In the above graph, we can clearly see that AXP stock price gave highly positive but some negative results to its investors, if we analyze it on yearly basis. Although, the AXP stock price hit its all-time high of $326.27 recently in January 2025.
Also Read : Tempus AI Inc. | TEM Stock Price Forecast 2025-2050 with complete analysis 🚨
Live chart analysis for American Express Stock Forecast
Before we start looking at the future values of AXP Stock Prices, have a close look at the current chart so we can understand where it is heading in future. Here, in AXP’s live chart, we can observe that, AXP started its up trend from November 2023 in which it reached $242 from $139 in 5 months. From April to September 2024, AMEX stock traded in a range of $250 to $220, but on Sept. 16, 2024 AMEX broke its range and started moving upwards. It reached its All Time High of $326.27 on Jan. 23, 2025. After creating All time high, AXP stock fell $255 till March 2025 where Bulls tried to support AXP stocks but failed and AMEX stock reached its new low of $220.43 on April 07, 2025. To get a clear picture, we have provide Multi-timeframe analysis of American Express.
Time-Frame analysis of American Express : Daily, Weekly, Monthly, Yearly
By a technical chart analysis of Simple Moving Averages (SMAs) on different timeframes, we can observe the following –
| Time Frame | Observation |
|---|---|
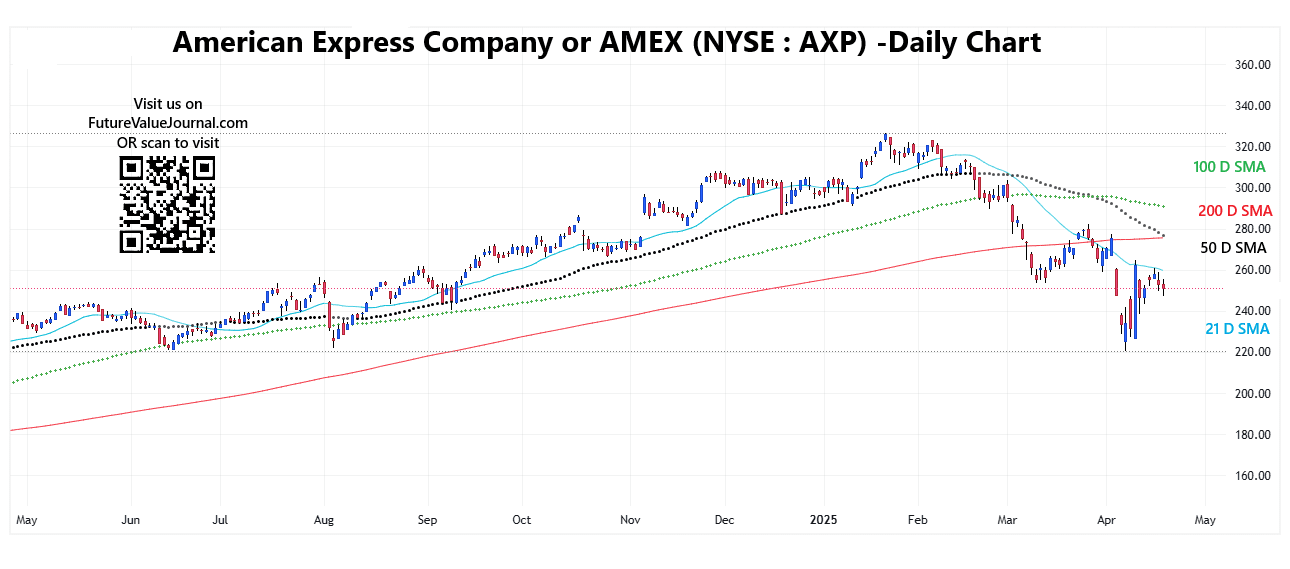 View Daily Chart (Every candle represents NYSE : AXP share’s trading session of one day. Each single candle represent the HIGH, LOW, OPEN, CLOSE of that particular day) | On the Daily time-frame American Express stock is trading BELOW 21 Days, 50 Days, 100 Days, 200 Days SMAs. This indicates that AMEX stock has a Sideways to Negative sentiment in medium term. |
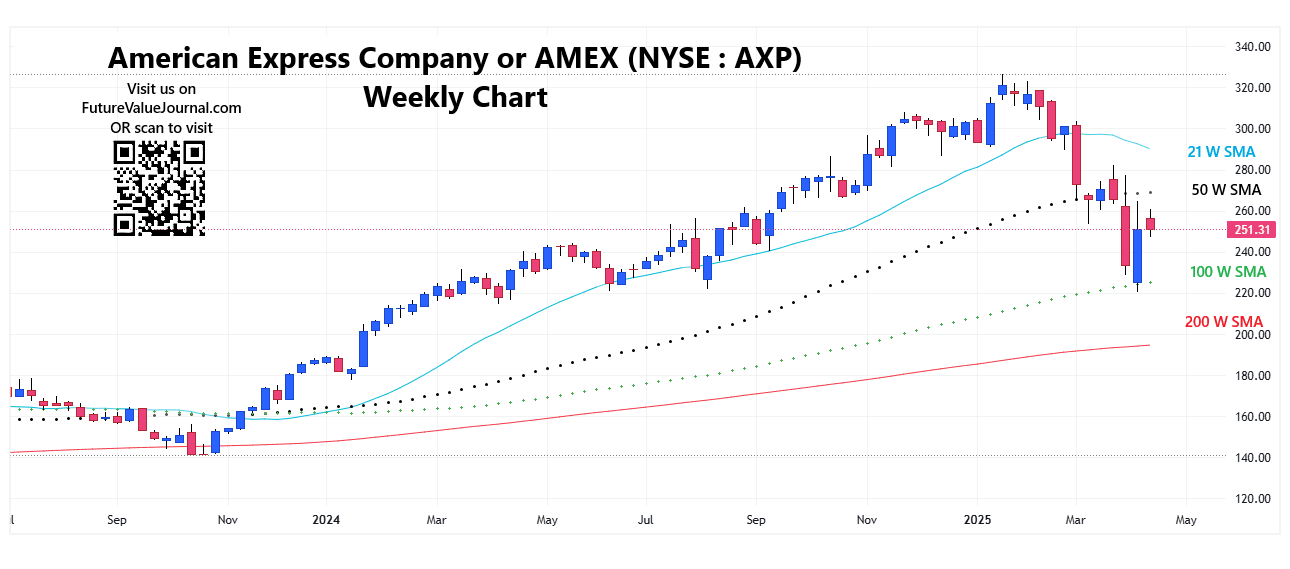 View Weekly Chart (Every candle represents NYSE : AXP share’s trading session of one week. Each single candle represent the HIGH, LOW, OPEN, CLOSE of that particular week) | On Weekly time-frame, we can observe that American Express stock is trading ABOVE 100 Weeks & 200 Weeks SMA but BELOW 21 Weeks & 50 Weeks SMAs . This is the sign of Sideways trend in Long term. |
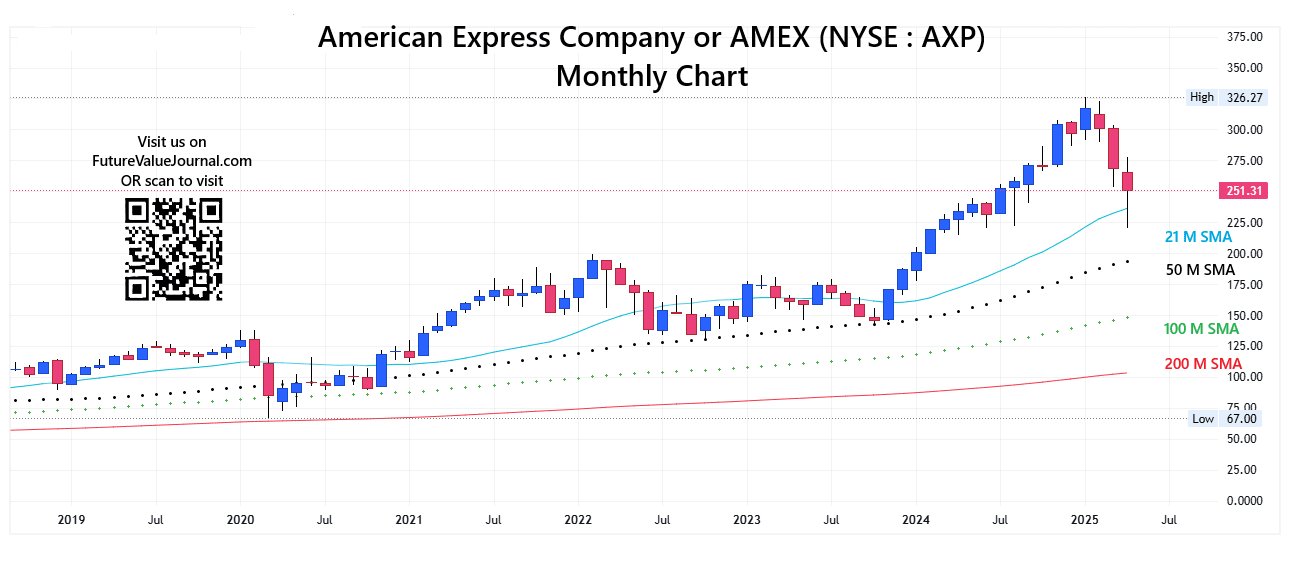 View Monthly Chart (Every candle represents NYSE : AXP stock’s trading session of one month. Each single candle represent the HIGH, LOW, OPEN, CLOSE of that particular month) | On Monthly time-frame, we can observe that American Express stock is trading ABOVE ALL the 21 Months, 50 Months, 100 Months & 200 Months SMAs. This indicates that the AMEX stock is in Bullish trend for Very Long term. |
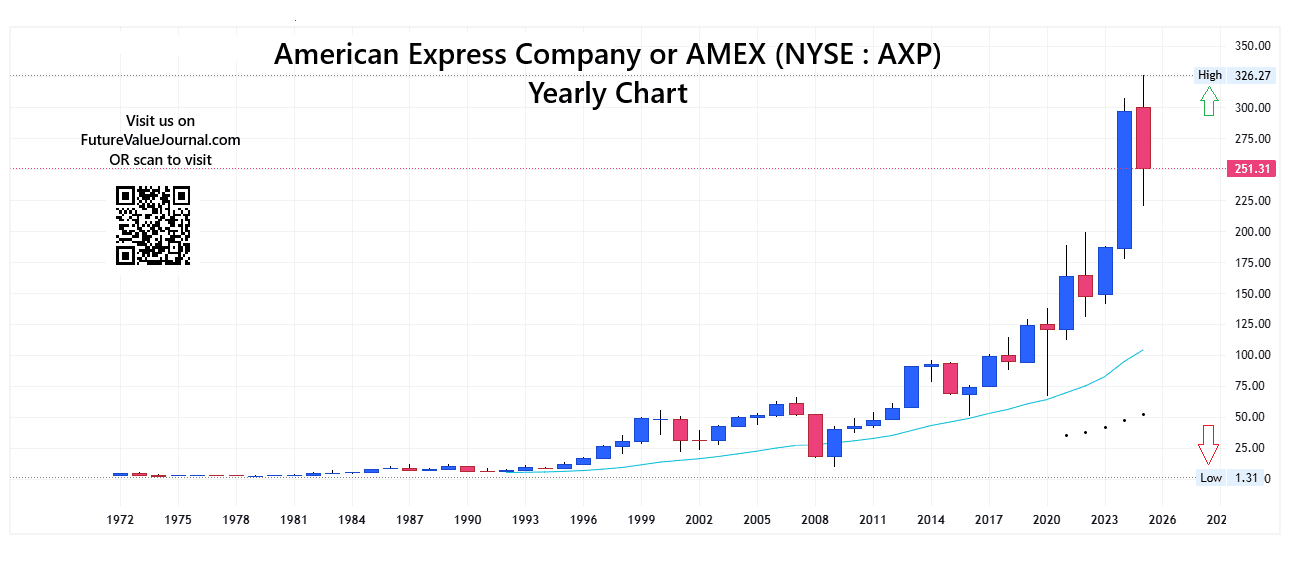 View Yearly Chart (Every candle represents NYSE : AXP stock’s trading session of one year. Each single candle represent the HIGH, LOW, OPEN, CLOSE of that particular year) | On yearly time-frame, we can observe that AXP stock is creating Higher Highs and Higher Lows since 2020. Its Bullish trend started in 2009 & with minor corrections, AMEX stocks are continuously heading in upward direction. |
The major support & resistance zone can be seen at the levels between $195 – $150. If we go for the directional analysis of the SMAs, we can see a Bullish trend in SMAs directions in multiple timeframes.
Dow Jones, Nasdaq & American Express : A comparative Analysis
Check out the comparative year on year returns of Dow Jones, Nasdaq and American Express. Here, we are showing the returns by comparing them on closing basis –
| Year | Dow Jones | Nasdaq | AXP |
|---|---|---|---|
| 2024 | +12.88% | +28.64% | +58.42% |
| 2023 | +13.70% | +43.42% | +26.80% |
| 2022 | -8.78% | -33.10% | -9.69% |
| 2021 | +18.73% | +21.39% | +35.31% |
| 2020 | +7.25% | +43.64% | -2.88% |
Here in the above table, we can clearly see the little correlation between Nasdaq & AXP stocks. We can interpret here is, when we consider investing or trading AXP stocks, we must consider the overall direction of markets before making any decision.
Also Read : 📦 Amazon Inc. | AMZN Stock Price Forecast 2025 – 2050 with Complete Analysis
American Express Peer Comparison / Competitors Analysis
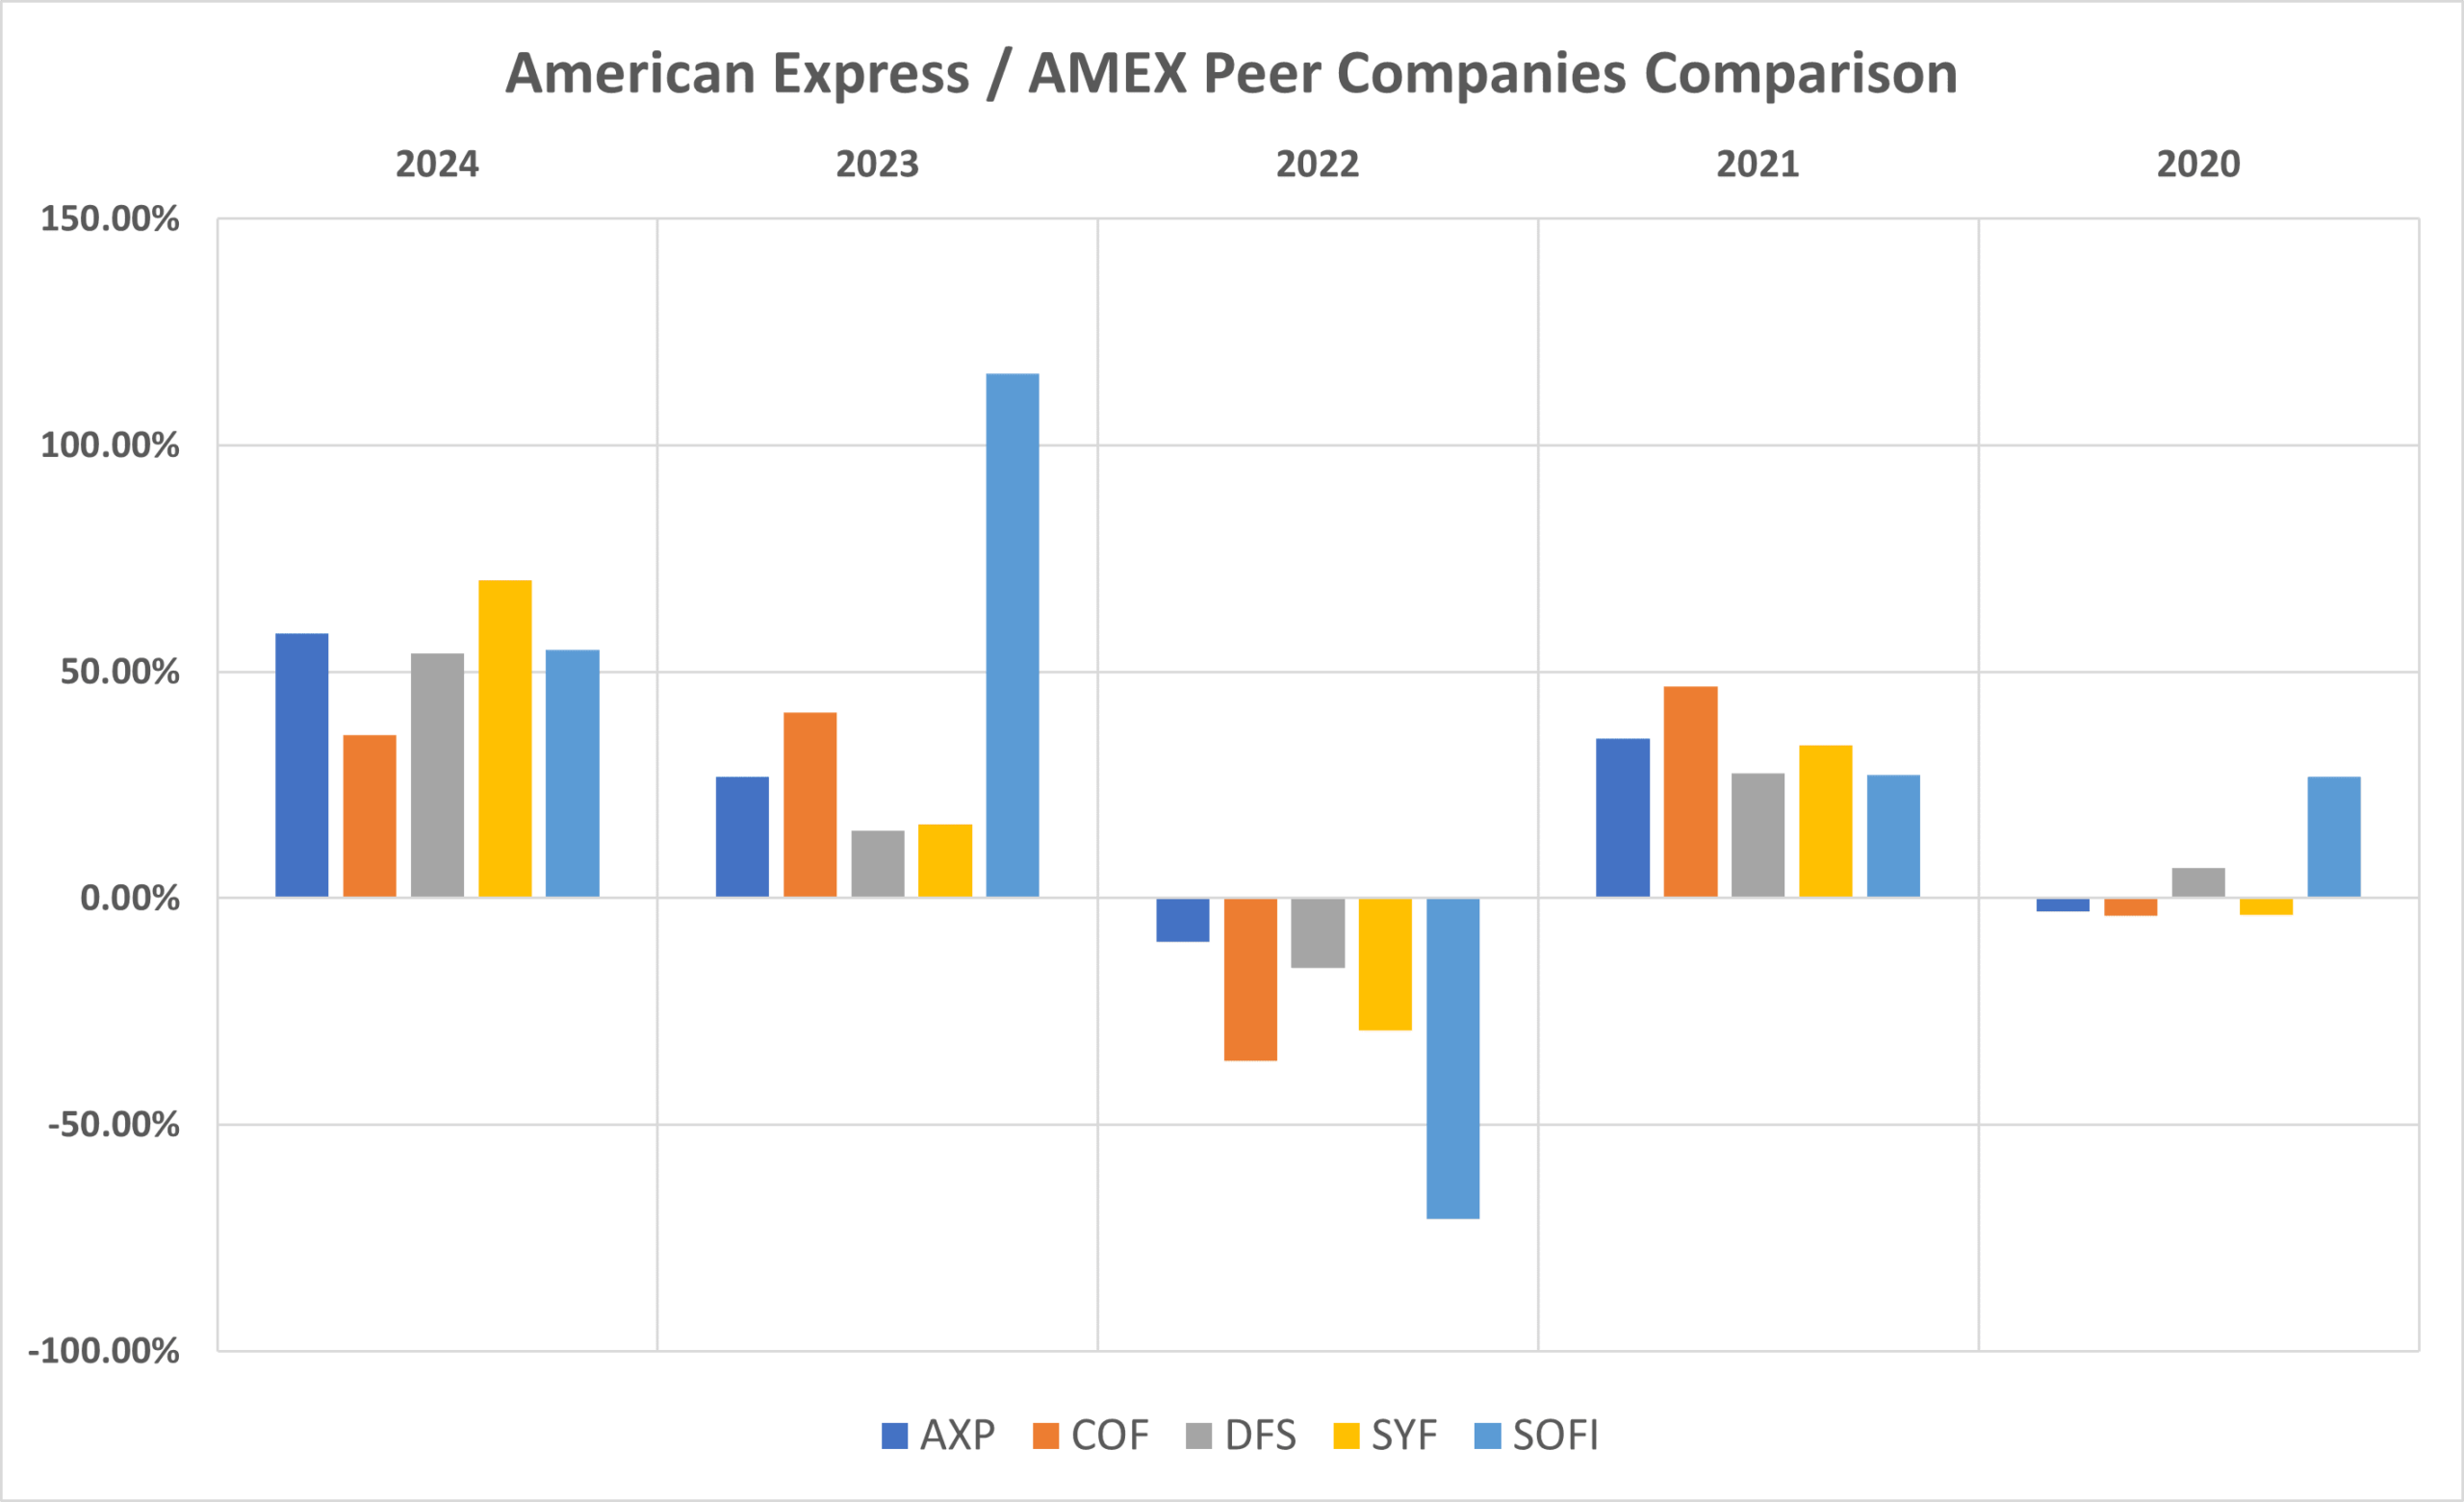
We will compare American Express Company (NYSE : AXP) to its top competitors. We will see how its peer companies performed year-on-year . Below is the comparative table of Capital One Financial Corporation (COF), Discover Financial Services (DFS), Synchrony Financial (SYF), SoFi Technologies Inc. (SOFI), Joint Stock Company Kaspi.kz (KSPI)‘s returns from 2020 to 2024 based on CLOSING Prices.
| Year | AXP | COF | DFS | SYF | SOFI |
|---|---|---|---|---|---|
| 2024 | +58.42% | +36.00% | +54.12% | +70.20% | +54.77% |
| 2023 | +26.80% | +41.05% | +14.89% | +16.22% | +115.84% |
| 2022 | -9.69% | -35.93% | -15.34% | -29.17% | -70.84% |
| 2021 | +35.31% | +46.78% | +27.65% | +33.65% | +27.09% |
| 2020 | -2.88% | -3.95% | +6.73% | -3.61% | +26.72% |
| Average Returns | +21.59% | +16.79% | +17.61% | +17.45% | +30.72% |
AXP has given a decent returns of +21.59% to its long-term investors if we look at the 5 years average returns. We didn’t considered Joint Stock company Kaspi.kz (KSPI) for this comparison since it got listed in 2024.
American Express Stock Forecast : Short & Long Term
American Express Stock Forecast 2025, 2026, 2027, 2028, 2029
| Year | Stock Price Target |
|---|---|
| AMEX stock price forecast for 2025 | $ 341.30 |
| AMEX stock price forecast for 2026 | $ 392.54 |
| AMEX stock price forecast for 2027 | $ 451.38 |
| AMEX stock price forecast for 2028 | $ 519.08 |
| AMEX stock price forecast for 2029 | $ 596.95 |
- In 2025, we expect the American Express stock price to reach around $341.30, representing a 14.97% increase from its 2024 closing price of $296.79.
- Looking ahead to 2026, AXP could rise to $392.54, showing a 32.27% gain from 2024.
- By 2027, the stock may climb to $451.38, marking an impressive 52.05% increase.
- Moving into 2028, we anticipate AXP could reach $519.08, reflecting a 74.84% gain from its 2024 close.
- Finally, by 2029, AXP could hit $596.95, representing a substantial 101.13% increase over its 2024 closing price.
American Express Stock Forecast 2030, 2035, 2040, 2050
| Year | Stock Price Target |
|---|---|
| AXP stock price forecast for 2030 | $ 686.49 |
| AXP stock price forecast for 2035 | $ 1209.83 |
| AXP stock price forecast for 2040 | $ 2132.14 |
| AXP stock price forecast for 2045 | $ 3757.56 |
| AXP stock price forecast for 2050 | $ 6622.16 |
- By 2030, our long-term analysis forecasts American Express stock price reaching $686.49, which would represent a 131.26% increase from its 2024 closing price of $296.79.
- Looking ahead to 2035, we estimate AXP stock could reach $1,209.83, showing a remarkable 307.72% return.
- By 2040, the stock is expected to rise to $2,132.14, reflecting a substantial 618.39% gain.
- By 2045, AXP could climb to $3,757.56, marking an outstanding 1,165.97% increase.
- Further into the future, by 2050, we forecast AXP stock could hit $6,622.16, indicating an impressive 2,130.35% increase from its 2024 closing price.
American Express Stock Forecast 2025 (month-wise)
| Month | Stock Price Target |
|---|---|
| AXP stock price prediction for March 2025 | $286.01 |
| AXP stock price prediction for April 2025 | $298.23 |
| AXP stock price prediction for May 2025 | $304.08 |
| AXP stock price prediction for June 2025 | $314.43 |
| AXP stock price prediction for July 2025 | $322.19 |
| AXP stock price prediction for August 2025 | $329.84 |
| AXP stock price prediction for September 2025 | $334.49 |
| AXP stock price prediction for October 2025 | $341.30 |
| AXP stock price prediction for November 2025 | $331.38 |
| AXP stock price prediction for December 2025 | $329.27 |
As per our analysis of American Express stock price, we are expecting that the prices may rise up to $341.30, offering an approximate 14.97% return on its 2024’s closing price of $296.79. This represents a DECENT return (ROI) for investors.
Also Read : 🚘 Tesla Stock Price Forecast 2025 – 2050 with Complete Analysis
Conclusion
To sum up, American Express (NYSE: AXP) is a well-established financial company that has shown steady growth over the years. Founded in 1850, it has a strong presence in the market with a market cap of $176.21 billion USD. One of its biggest shareholder is Berkshire Hathaway, which owns around 21.5% of the company. The stock hit its highest price of $326.27 in January 2025 and has shown a sideways to bullish trend on multi-timeframe charts.
Over the past five years, AXP has delivered an average return of 21.59%, performing better than peer company stocks. Based on current analysis, the share price could reach as high as $6,622.16 by 2050. Overall, American Express remains a solid long-term investment option for those looking for stability and growth.
Frequently Asked Questions (FAQs)
1) Will American Express stock price reach $500?
As per our current analysis, we could guess that AMEX stock price can reach $500 during 2027 – 2028. AMEX stock is a giant, it can’t just go up without any reason, unless American Express innovate & launch some groundbreaking technology in online payment sector.
2) What is the American Express stock forecast for 2030?
In 2030, we are expecting AXP stock price to reach around $686.49.
3) What is the American Express stock forecast for 2050?
During 2050, we can see AXP stock price to hit $6622.16.
4) Is American Express Company a good long term investment?
In our opinion, yes — American Express is a strong candidate for long-term investment. It’s considered a ‘Too Big to Fail’ company, which shows its strength and stability. Founded in 1850, it has a legacy of over 174 years — something only a few companies can achieve.
5) What is the American Express stock forecast for 2025?
$341.30 per share is the American Express stock forecast for 2025.
6) What is the American Express stock forecast for 2026?
In 2026, we are expecting AXP stock price to reach around $392.54.
7) What is the American Express stock forecast for 2027?
$451.38 is the American Express stock forecast for 2027.
8) What is the American Express stock forecast for 2028?
In 2028, we are expecting AXP stock price to reach around $519.08.
9) What is the American Express stock forecast for 2029?
$596.95 is the American Express stock forecast for 2029.
Disclaimer : Not an Investment Advice
The content shared here in “💳 AXP | American Express Stock Forecast 2025-2050 with Complete Analysis” is for general information only. It’s not intended as financial, investment, or professional advice. Always consult a qualified professional—whether legal, financial, or tax-related—before making any investment decisions.


Spot on with this write-up, I really suppose this website needs far more consideration. I’ll in all probability be once more to read much more, thanks for that info.
Hi! I know this is somewhat off topic but I was wondering which blog platform are you using for this website? I’m getting fed up of WordPress because I’ve had issues with hackers and I’m looking at alternatives for another platform. I would be awesome if you could point me in the direction of a good platform.
I am curious to find out what blog system you happen to be using? I’m having some minor security issues with my latest blog and I’d like to find something more safe. Do you have any suggestions?
I got what you intend, appreciate it for posting.Woh I am pleased to find this website through google.