🖥️INTC | Intel Stock Forecast 2025 – 2050 with Detailed Analysis
➡️ 30 Seconds Summary ⬅️
Intel Corporation (Nasdaq : INTC) has been a pioneer of the global semiconductor industry, powering everything from personal computers to data centers. Since 1968, Intel has built a legacy of innovation and resilience, even in highly competitive tech markets. As investors look toward the future, this blog dives deep into Intel’s stock forecast from 2025 to 2050, backed by historical performance, market trends, and growth potential. Keep reading to explore whether INTC is a smart long-term investment.
We will also compare Intel’s performance with major indices as well as with its peer companies. We will also analyze Intel stock on multiple timeframe and based on this analysis, we will estimate its future prices which will help you in taking precise investment decision. In this post “INTC | Intel Stock Forecast 2025 – 2050 with Detailed Analysis“, we’ll conduct complete analysis backed by data, trends, and expert analysis to help you understand where INTC could be headed in the decades to come.
About Intel Corporation (Nasdaq : INTC)
| Company Name | Intel Corporation |
| Stock Exchange | Nasdaq |
| Ticker Symbol | INTC |
| Sector | IT Industry, Technology |
| Headquarter | California, US |
| Founded in | 1968 |
| Major Shareholder | Vanguard Group (~8.5%) |
| Market Cap. | $ 79.79 billion USD |
| Revenue(2024) | $ 53.2 billion USD |
| Total Assets | $ 196.5 billion USD |
| All-time HIGH price | $ 75.81 USD (Aug. 28, 2000) |
| All-time LOW price (since 2000) | $ 12.05 USD (Feb 23, 2009) |
| Peer Companies | Analog Devices Inc (ADI), Micron Technology Inc. (MU), Arm Holdings plc. (ARM), Marvell Technology Inc. (MRVL), NXP Semiconductors N.V. (NXPI) |
Intel Corporation (NASDAQ: INTC), founded in 1968, is one of the world’s leading semiconductor companies with a long-standing reputation for innovation and technology leadership. With a current market capitalization of $79.79 billion USD, Intel has seen both highs and lows in its journey — reaching an all-time high of $75.81 and a low of $12.05 per share. As a pioneer in chip manufacturing and computing advancements, Intel has remained a prominent name in global tech markets. Now, we’ll begin by analyzing Intel’s five year price movement for better understanding of Intel’s performance before diving into its future.
Intel Corporation (Nasdaq : INTC) | Past, Present & Future
Intel Corporation (INTC) | Historical price analysis
| Year | Open | High | Low | Close | % Change |
|---|---|---|---|---|---|
| 2024 | 49.20 | 50.30 | 18.51 | 20.05 | -60.10% |
| 2023 | 27.05 | 51.28 | 24.73 | 50.25 | +90.12% |
| 2022 | 51.65 | 56.28 | 24.59 | 26.43 | -48.68% |
| 2021 | 49.89 | 68.49 | 47.87 | 51.50 | +3.37% |
| 2020 | 60.24 | 69.29 | 43.61 | 49.82 | -16.76% |
In the above graph, we can clearly see that Intel stock price gave positive as well as negative results to its investors in every alternate year. Intel stock price hit its all-time high of $75.81 during the year 2000 but never reached that level again since 25 years..
Also Read : Tempus AI Inc. | TEM Stock Price Forecast 2025-2050 with complete analysis 🚨
Live chart analysis for Intel Stock Price Forecast
Before we start looking at the future values of Intel Stock Prices, have a close look at the current chart so we can understand where it is heading in future. Here, in Intel’s live chart, we can observe that, Intel started its down trend since January 2024 end, where it traded in the range of $42-$46. On April 03, 2024 Intel broke its range to the downside and suddenly fell to $31 till April end. From April to July 2024, Intel stock traded in the range of $29.97 to $32.50. Intel tried to break its range to the upside but failed. On August 01, 2024 Intel broke its range to the downside. On the very next trading day, it opened gap down from $29.05 to $21.94. Since then, Intel is trading in a range of $18.50 to $25. Today on April 21,2025 it is still trading at the lower side of the range. Let’s analyze it on the multiple timeframes, to get the clear picture.
Time-Frame analysis of Intel Corp. : Daily, Weekly, Monthly, Yearly
By a technical chart analysis of Simple Moving Averages (SMAs) on different timeframes, we can observe the following –
| Time Frame | Observation |
|---|---|
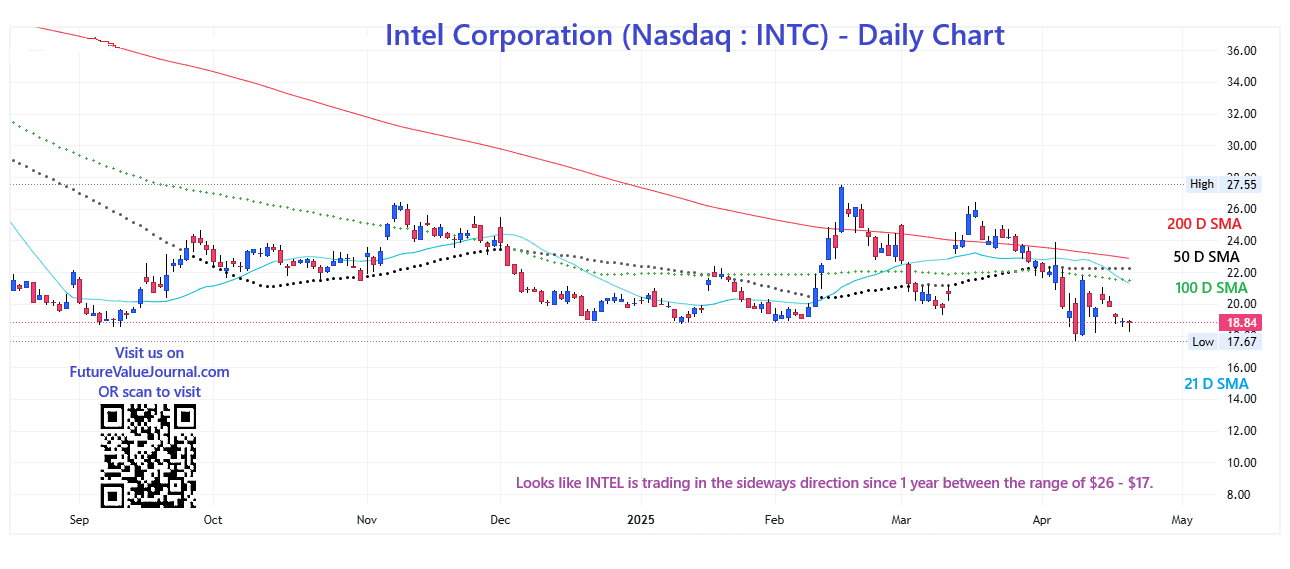 View Daily Chart (Every candle represents Nasdaq : INTC share’s trading session of one day. Each single candle represent the HIGH, LOW, OPEN, CLOSE of that particular day) | On the Daily time-frame Intel stock is trading BELOW 21 Days, 50 Days, 100 Days & 200 Days SMAs. This indicates that Intel stock has a Sideways to Negative sentiment in medium term. |
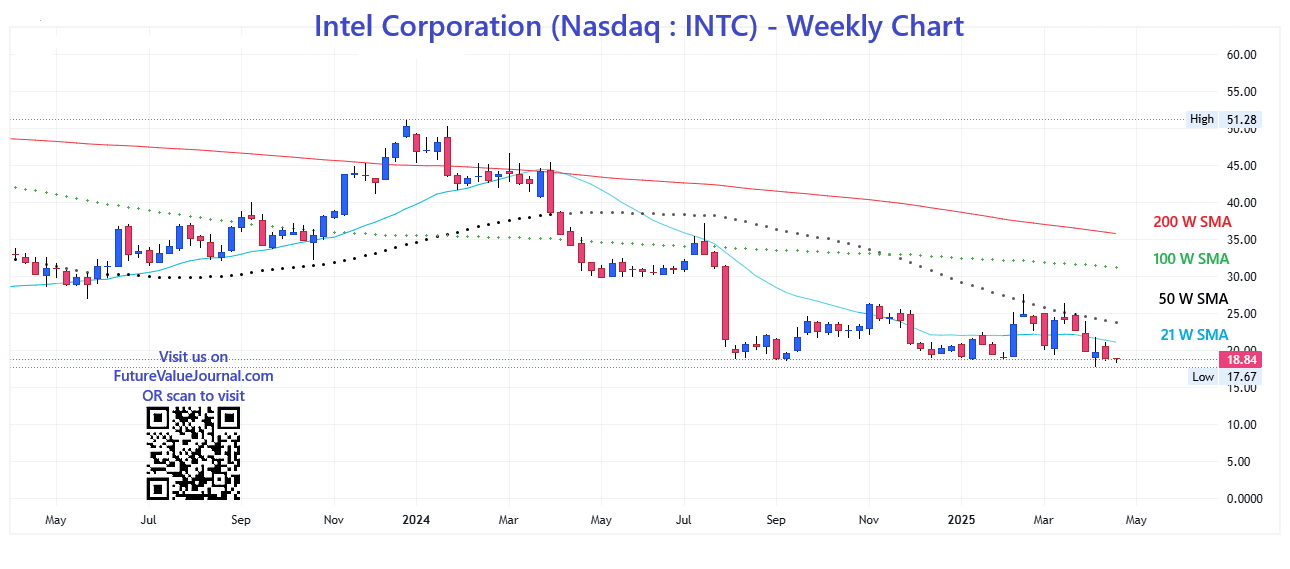 View Weekly Chart (Every candle represents Nasdaq : INTC share’s trading session of one week. Each single candle represent the HIGH, LOW, OPEN, CLOSE of that particular week) | On Weekly time-frame, we can observe that Intel stock is trading BELOW all the 21 Weeks, 50 Weeks, 100 Weeks SMA & 200 Weeks SMAs . This is the clear sign of Sideways to Bearish trend in Long term. |
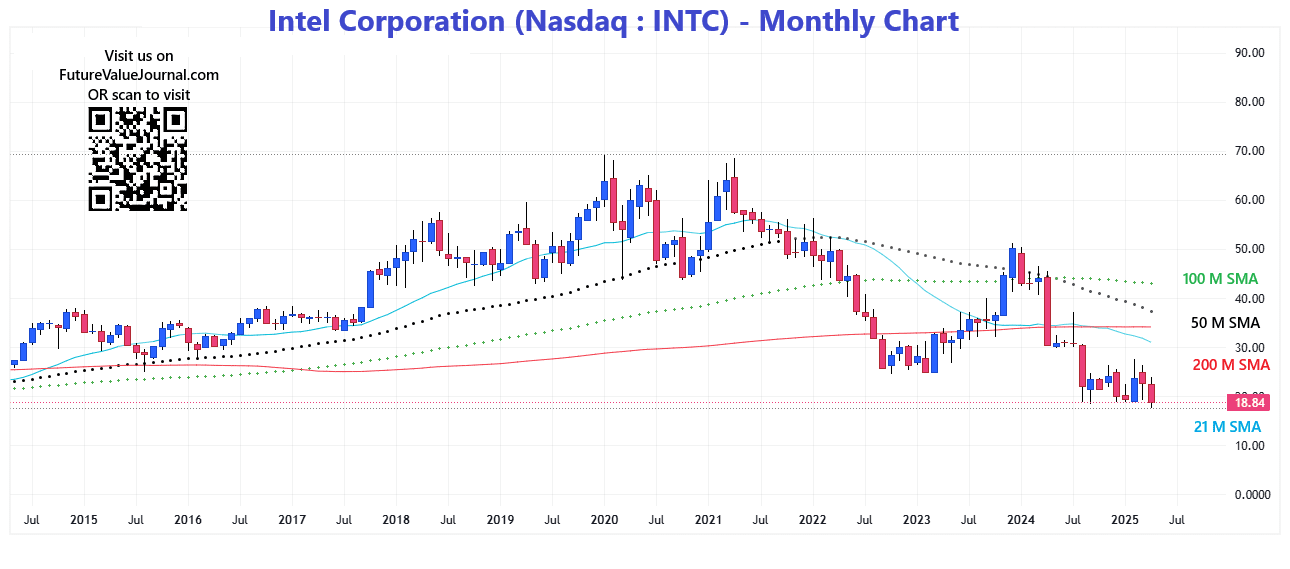 View Monthly Chart (Every candle represents Nasdaq : INTC stock’s trading session of one month. Each single candle represent the HIGH, LOW, OPEN, CLOSE of that particular month) | On Monthly time-frame, we can observe that Intel stock is trading BELOW all the 21 Months, 50 Months, 100 Months & 200 Months SMAs. This indicates that the Intel stock is in Bearish trend for Very Long term. |
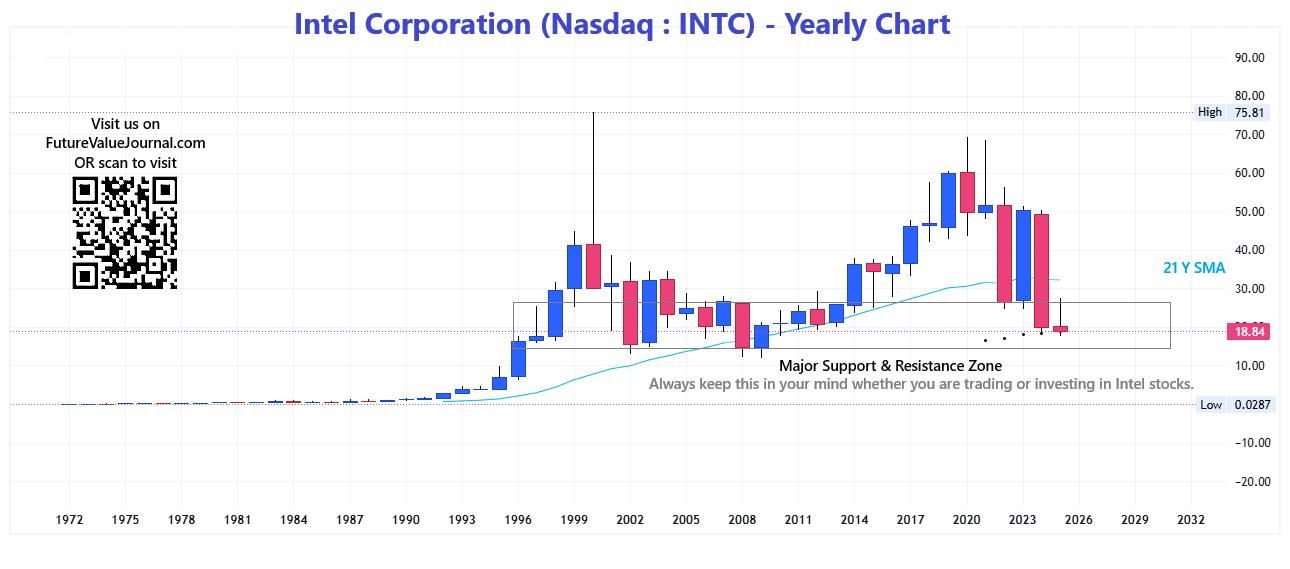 View Yearly Chart (Every candle represents Nasdaq : INTC stock’s trading session of one year. Each single candle represent the HIGH, LOW, OPEN, CLOSE of that particular year) | In the yearly chart also, we can clearly see the range of Intel stock is between $15 to $65. We have also market the major Support and resistance in the chart. |
The major support can be seen at the levels between $17 – $23. If we go for the directional analysis of the SMAs, we can see a Sideways to Bearish trend in SMAs directions in multiple timeframes.
Dow Jones, Nasdaq & Intel : A comparative Analysis
Check out the comparative year on year returns of Dow Jones, Nasdaq and Intel Corporation. Here, we are showing the returns by comparing them on closing basis –
| Year | Dow Jones | Nasdaq | Intel |
|---|---|---|---|
| 2024 | +12.88% | +28.64% | -60.10% |
| 2023 | +13.70% | +43.42% | +90.12% |
| 2022 | -8.78% | -33.10% | -48.68% |
| 2021 | +18.73% | +21.39% | +3.37% |
| 2020 | +7.25% | +43.64% | -16.76% |
Here in the above table, we can clearly see that their is NO correlation between Dow, Nasdaq & Intel stocks. This indicates that the overall market direction have low to no effect on Intel stock movement.
Also Read : 📦 Amazon Inc. | AMZN Stock Price Forecast 2025 – 2050 with Complete Analysis
Intel Peer Comparison / Competitors Analysis
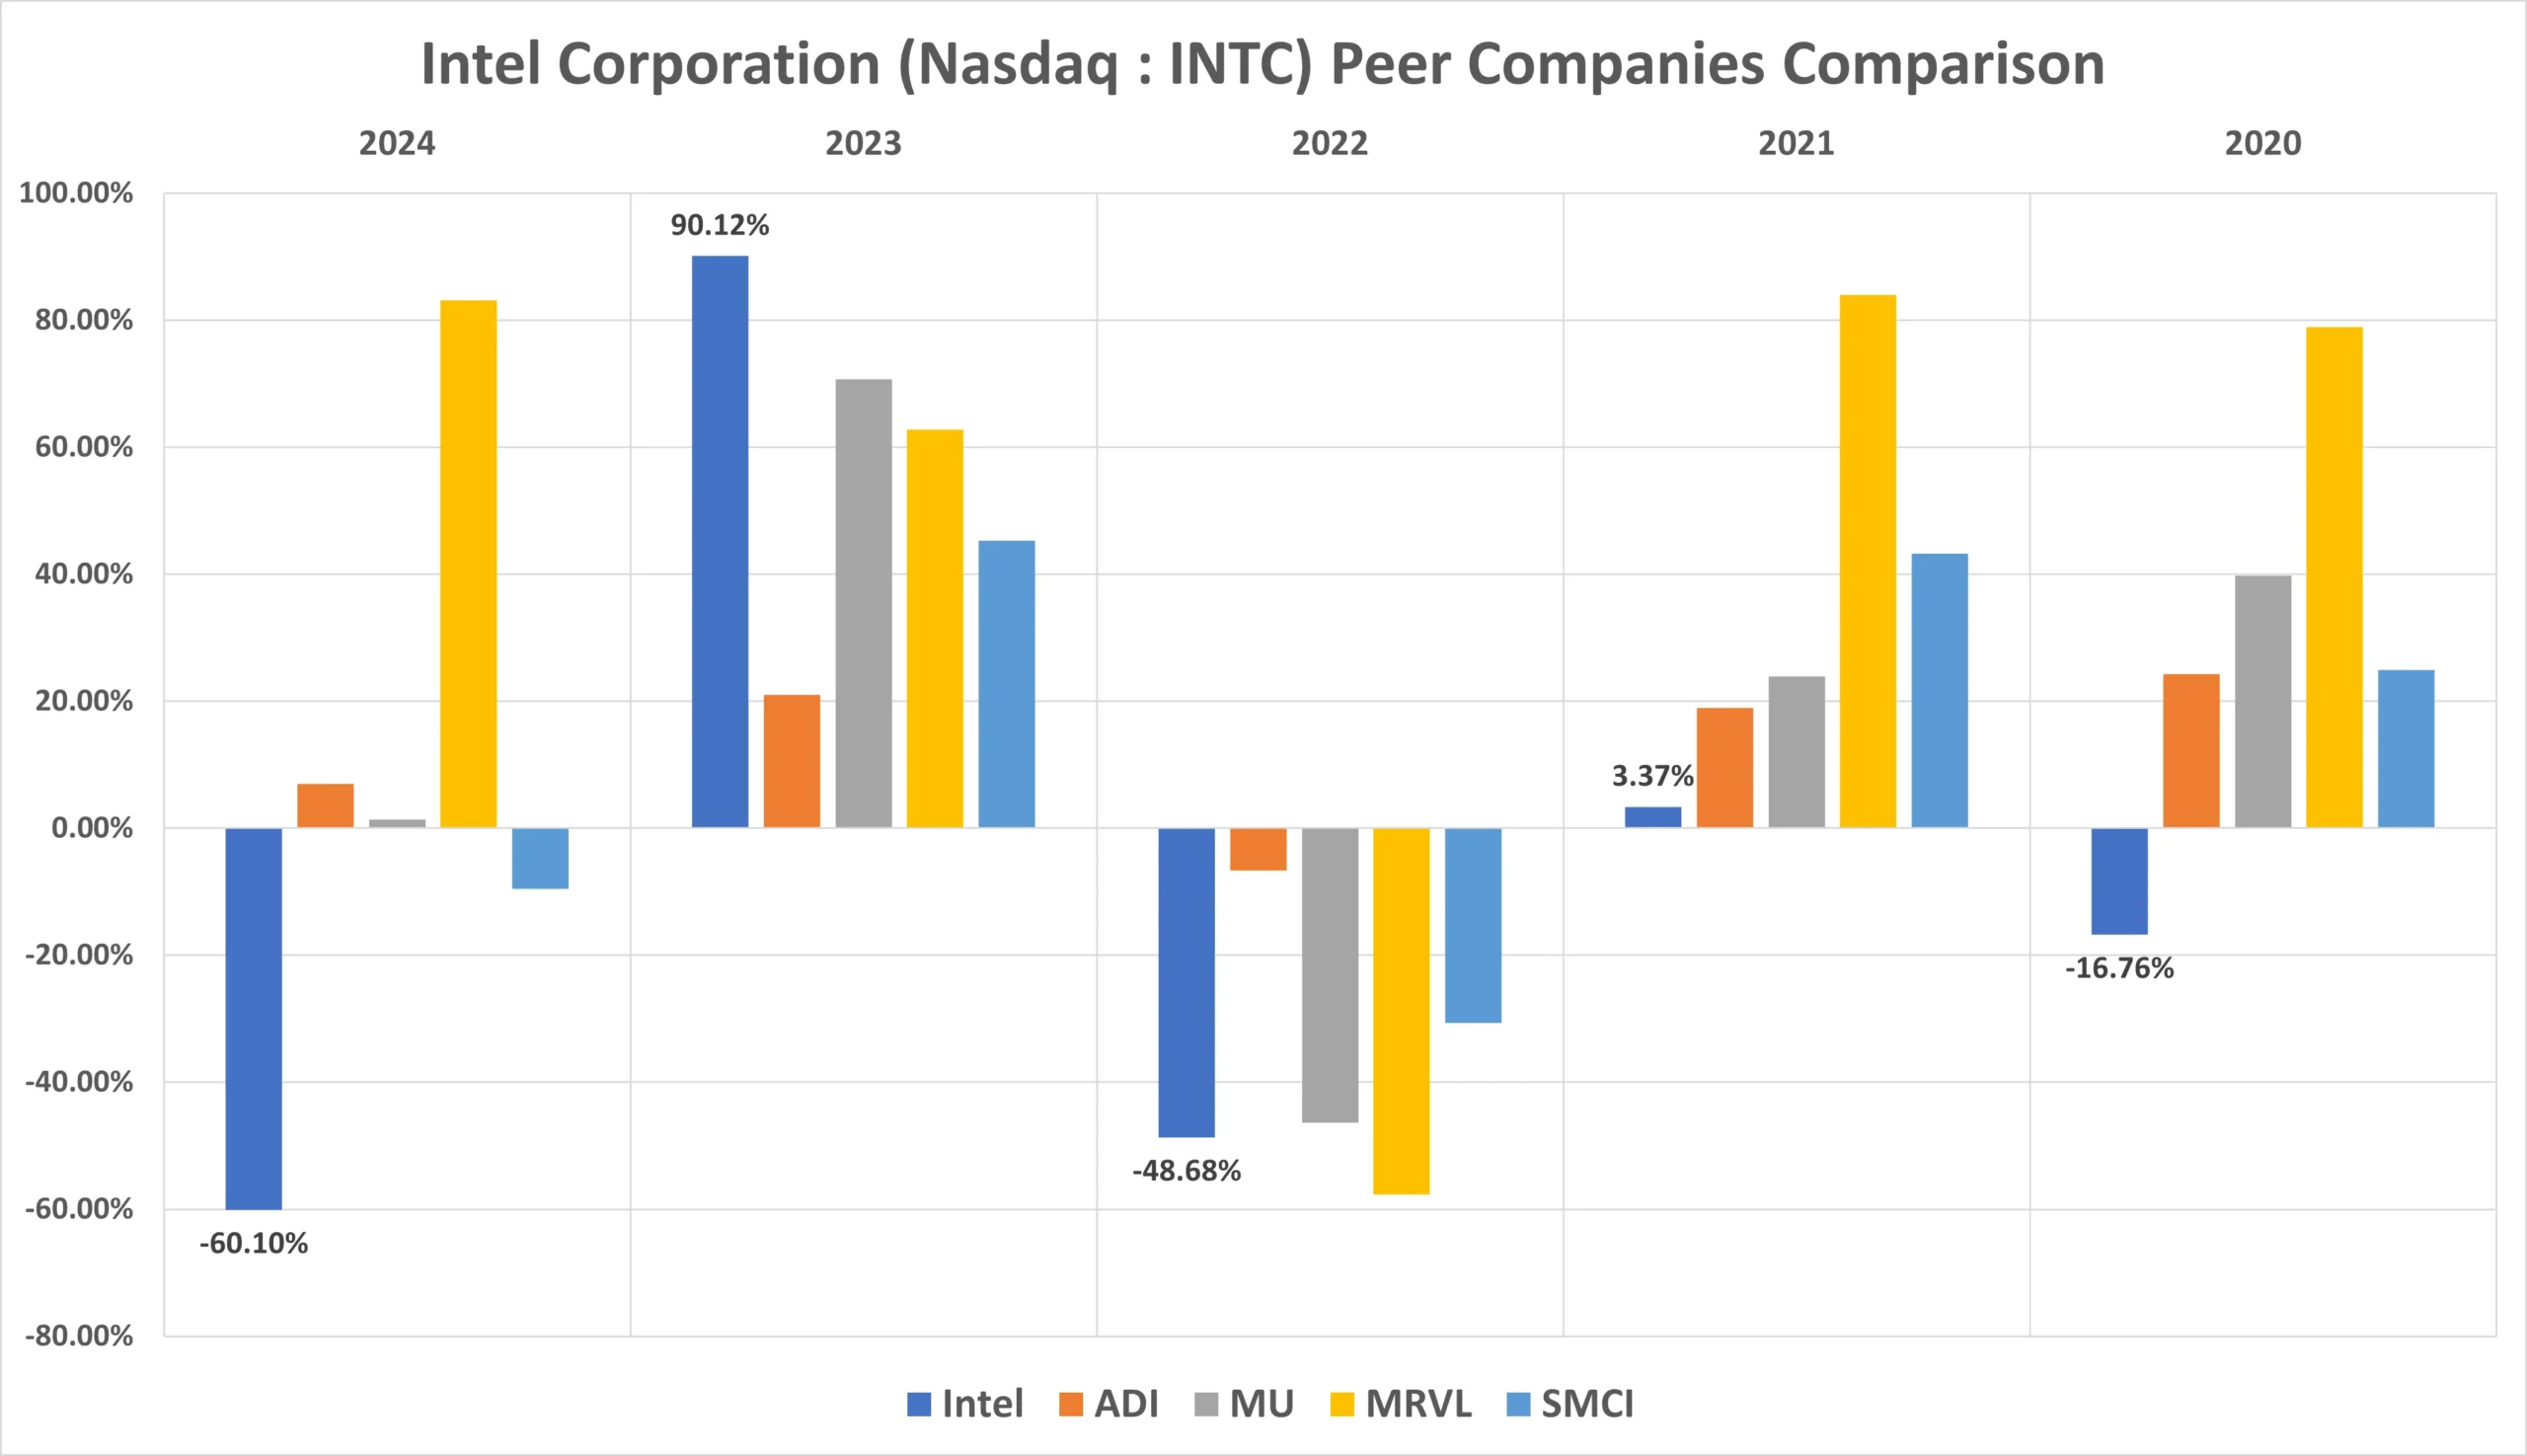
We will compare Intel Corp. (Nasdaq : INTC) to its top competitors. We will see how its peer companies performed year-on-year . Below is the comparative table of Analog Devices Inc (ADI), Micron Technology Inc. (MU), Arm Holdings plc. (ARM), Marvell Technology Inc. (MRVL), NXP Semiconductors N.V. (NXPI)’s returns from 2020 to 2024 based on CLOSING Prices.
| Year | Intel | ADI | MU | MRVL | NXPI |
|---|---|---|---|---|---|
| 2024 | -60.10% | +7.00% | +1.38% | +83.14% | -9.50% |
| 2023 | +90.12% | +21.05% | +70.75% | +62.82% | +45.34% |
| 2022 | -48.68% | -6.68% | -46.34% | -57.66% | -30.62% |
| 2021 | +3.37% | +18.98% | +23.90% | +84.03% | +43.25% |
| 2020 | -16.76% | +24.31% | +39.79% | +78.99% | +24.95% |
| Average Returns | -6.14% | +12.93% | +17.89% | +50.26% | +14.68% |
Intel has given a negative returns of -6.14% to its long-term investors if we look at the 5 years average returns. Since Arm Holdings plc. (ARM) got listed in 2023, we are didn’t considered it in the above comparison.
Intel Stock Forecast : Short & Long Term
Intel Stock Forecast 2025, 2026, 2027, 2028, 2029
| Year | Stock Price Target |
|---|---|
| Intel stock forecast for 2025 | $ 23.05 |
| Intel stock forecast for 2026 | $ 26.51 |
| Intel stock forecast for 2027 | $ 30.49 |
| Intel stock forecast for 2028 | $ 35.06 |
| Intel stock forecast for 2029 | $ 40.32 |
- In 2025, we expect Intel’s stock price to reach around $23.05, representing a 14.96% increase from its 2024 closing price of $20.05.
- Looking ahead to 2026, Intel could rise to $26.51, showing a 32.26% gain.
- By 2027, the stock may climb to $30.49, marking an impressive 52.10% increase.
- Moving into 2028, we anticipate Intel could reach $35.06, reflecting a 74.87% gain.
- Finally, by 2029, Intel could hit $40.32, representing a substantial 101.07% increase from its 2024 closing price.
Intel Stock Price Forecast 2030, 2035, 2040, 2050
| Year | Stock Price Target |
|---|---|
| Intel stock forecast for 2030 | $ 46.37 |
| Intel stock forecast for 2035 | $ 93.23 |
| Intel stock forecast for 2040 | $ 187.62 |
| Intel stock forecast for 2045 | $ 377.37 |
| Intel stock forecast for 2050 | $ 759.02 |
- By 2030, our long-term analysis forecasts Intel’s stock price reaching $46.37, which would represent a 131.26% increase from its 2024 closing price of $20.05.
- Looking ahead to 2035, we estimate Intel stock could reach $93.23, showing a remarkable 365.00% return.
- By 2040, the stock is expected to rise to $187.62, reflecting a substantial 835.42% gain.
- By 2045, Intel could climb to $377.37, marking an outstanding 1,781.05% increase.
- Further into the future, by 2050, we forecast Intel stock could hit $759.02, indicating an impressive 3,686.29% increase from its 2024 closing price of $20.05.
Intel Stock Price Prediction 2025 (month-wise)
| Month | Stock Price Target |
|---|---|
| Intel stock price prediction for March 2025 | $18.80 |
| Intel stock price prediction for April 2025 | $19.65 |
| Intel stock price prediction for May 2025 | $20.04 |
| Intel stock price prediction for June 2025 | $20.90 |
| Intel stock price prediction for July 2025 | $21.60 |
| Intel stock price prediction for August 2025 | $22.10 |
| Intel stock price prediction for September 2025 | $22.50 |
| Intel stock price prediction for October 2025 | $22.95 |
| Intel stock price prediction for November 2025 | $23.05 |
| Intel stock price prediction for December 2025 | $22.17 |
As per our analysis of Intel stock price, we are expecting that the prices may rise up to $23.06, offering an approximate 14.96% return on its 2024 closing price of $20.05. This represents a DECENT return (ROI) for investors.
Also Read : American Express Stock Forecast 2025-2050 with Complete Analysis
Conclusion
Intel Corporation (NASDAQ: INTC), founded in 1968, is a legacy tech company with over five decades of innovation in the semiconductor industry. With a current market cap of $79.79 billion USD and 2024’s revenue standing at $53.2 billion USD, Intel remains a significant player despite market competition. Its all-time high of $75.81 USD and strong support range between $17 and $23 show that the stock has investor’s interest. Based on long-term projections, Intel’s stock has the potential to reach around $759.02 by 2050. While growth may not be rapid, its steady progress and historical strength make INTC a worthy consideration for long-term investors seeking stability and upside.
Frequently Asked Questions (FAQs)
1) Will Intel stock price reach $100?
As per our current analysis, we could guess that it will be hard for Intel stock to reach $100 in near future. Firstly, it is really very far from its current price & its also above its All time high which Intel created in 2000s. Unless Intel Corporation innovate & launch something really groundbreaking, we cannot expect this price sooner.
2) Is Intel a good stock to buy, sell or hold?
In our opinion, currently Intel is a good stock to HOLD. BUT if you are looking for a fresh buy, you should wait for some time because it is roaming in the support zone. Although there are many more opportunities available in which you can invest other than semiconductor manufacturing industry.
3) What is the Intel stock forecast for 2030?
In 2030, we are expecting Intel stock price to reach around $46.37.
4) What is the Intel stock forecast for 2050?
During 2050, we might see Intel stock price to hit $759.02.
5) What is the Intel stock forecast for 2025?
As per current market conditions, Intel stock price could reach up to $23.05 per share in 2025.
6) What is the Intel stock price prediction for 2026?
In 2026, we are expecting Intel stock price to reach around $26.51.
7) What is the Intel stock forecast for 2027?
In 2027, we are expecting Intel stock price to reach around $30.49.
8) What is the Intel stock price prediction for 2028?
In 2028, we are expecting Intel stock price to reach around $35.06.
9) What is the Intel stock forecast for 2029?
In 2029, we are expecting Intel stock price to reach around $40.32.
Disclaimer : Not an Investment Advice
The content shared here in “🖥️INTC | Intel Stock Forecast 2025 – 2050 with Detailed Analysis” is for general information only. It’s not intended as financial, investment, or professional advice. Always consult a qualified professional—whether legal, financial, or tax-related—before making any investment decisions.


I got what you intend, regards for posting.Woh I am lucky to find this website through google.
I enjoy your writing style truly loving this web site.
I am really impressed with your writing skills as well as with the layout on your weblog. Is this a paid theme or did you modify it yourself? Either way keep up the excellent quality writing, it is rare to see a great blog like this one today..
I enjoy the efforts you have put in this, appreciate it for all the great blog posts.
This post made my day. So helpful!