Tempus AI Inc. | TEM Stock Price Forecast 2025-2050 with complete analysis

➡️ 30 Seconds Summary ⬅️
Tempus AI Inc. (NASDAQ: TEM) is a company that uses artificial intelligence to help improve healthcare and patient treatment. As AI becomes more important in the medical field, many investors are showing interest in Tempus and its future growth. In this blog post, we’ll look at the TEM stock price forecast from 2025 to 2050 and what the future might hold for this innovative company.
In this article “Tempus AI Inc. | TEM Stock Price Forecast 2025-2050” we are going to analyze TEM stock price past performance and on the basis of which we will estimate its future prices. We will also compare Tempus AI performance with major indices as well as its peer companies. We will also analyze Tempus AI on different timeframe and based on this detailed analysis, we will estimate its future performance which will help you in taking precise investment decision.
About Tempus AI, Inc. (TEM)
| Company Name | Tempus AI, Inc. |
| Stock Exchange | Nasdaq |
| Ticker Symbol | TEM |
| Sector | Technology (Health) |
| Headquarter | Chicago |
| Founded in | 2015 |
| Major Shareholder | Eric Lefkofsky (24.20%) |
| Market Cap. | $ 7.33 billion USD |
| Revenue(2024) | $ 241.6 million USD |
| Total Assets | $ 926.12 million USD |
| All-time high closing price | $ 91.45 USD (Feb 14, 2025) |
| 52-week low | $ 22.89 USD (June 25, 2024) |
| 52-week high | $ 91.45 USD (Feb 14, 2025) |
| Peer Companies | Qiagen N.V. (QGEN), Bio-Techne Corp. (TECH), Medpace Holdings, Inc. (MEDP), Bio-Rad Laboratories, Inc (BIO), Charles River Laboratories International, Inc (CRL) |
Tempus AI, Inc. (Nasdaq : TEM) | Past, Present & Future
Tempus AI (TEM) | Historical price analysis
| Month | Open | High | Low | Close | % Change |
|---|---|---|---|---|---|
| Mar 25 | 57.55 | 61.50 | 42.10 | 48.24 | -14.13% |
| Feb 25 | 53.63 | 91.45 | 50.50 | 56.18 | +4.75% |
| Jan 25 | 33.89 | 62.15 | 31.36 | 57.39 | +69.99% |
| Dec 24 | 65.62 | 68.95 | 32.40 | 33.76 | -46.00% |
| Nov 24 | 45.60 | 79.49 | 39.34 | 62.59 | +40.27% |
| Oct 24 | 56.71 | 57.03 | 42.24 | 44.62 | -21.17% |
| Sept 24 | 59.05 | 62.20 | 43.33 | 56.60 | -2.78% |
| Aug 24 | 44.92 | 77.00 | 32.80 | 59.38 | +37.20% |
| July 24 | 37.00 | 47.09 | 30.77 | 43.28 | +23.66% |
| June 24 | 40.00 | 43.88 | 22.89 | 35.00 | Listed |
In the above table, we can clearly see that TEM stock price gave little mixed returns to its investors if we analyze it on monthly basis. TEMPUS stock price hit its all-time high of $91.45 recently.
Also Read : Lucid (LCID) stock forecast for 2025 to 2050 : You should know
Live chart analysis for TEM stock price forecast 2025
Before we start looking at the future values of TEM Stock Prices, have a close look at the current chart so we can understand where it is heading in future. Here, in Tempus AI’s live chart, we can interpret that the stock completed its One bullish cycle from (Jan 21, 2025) $43.07 to $91.45 & back to $42.40 as on March 13, 2025. It tried to move up in March 2025, but failed and came back to its cyclic lower levels of $42.58 as on April 04,2025.
Prior to the above cycle, the stock had experienced two similar kind of ups & downs in the year 2024. Its first cycle peaked at $77.00 (Aug 22, 2024) and second cycle at $79.49 (Nov 12, 2024). On the basis of that, you can take some trades whenever TEM stock price gives a new breakout with the target of previous peaks & the stoploss of its support levels which are discussed in coming sections.
Time-Frame analysis of TEM : Hourly, Daily & Weekly
By doing a simple time-frame analysis of its technical chart & applying multiple Simple Moving Averages (SMAs) on, we can observe the following –
| Time Frame | Observation |
|---|---|
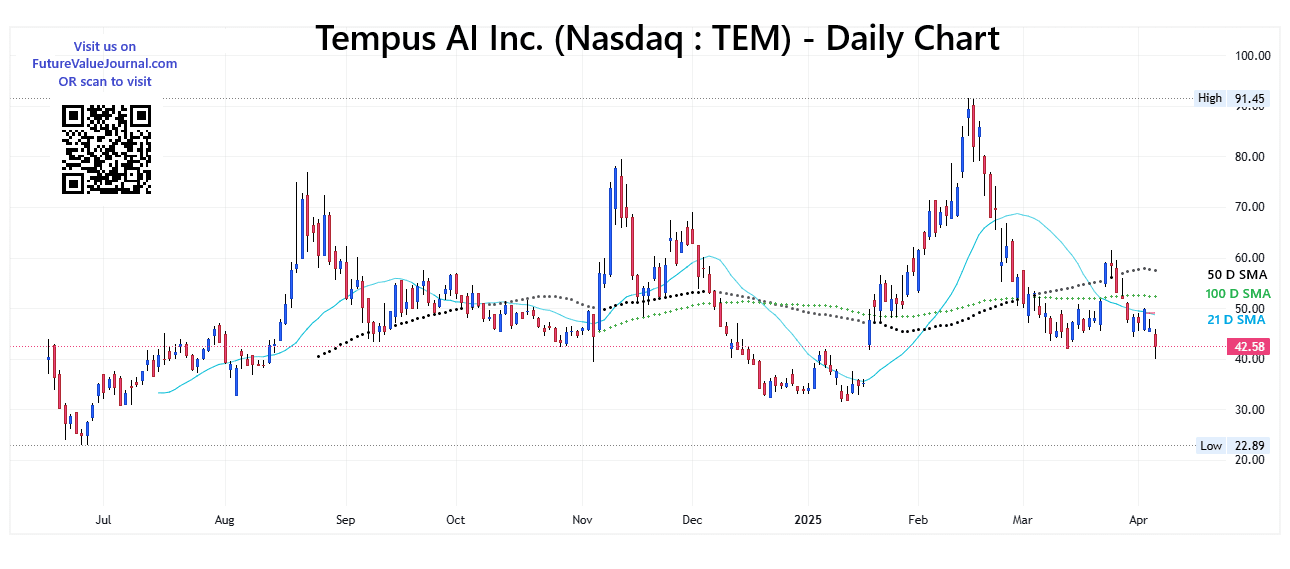 View Daily Chart (Every candle represents Nasdaq : TEM share’s trading session of one Daily. Each single candle represent the HIGH, LOW, OPEN, CLOSE of that particular daily) | On the Daily time-frame TEM stock is trading BELOW 21 Days , 50 Days, 100 Days, 200 Days SMAs. This indicates that TEM stock has a Sideways to Negative sentiment in medium term.. |
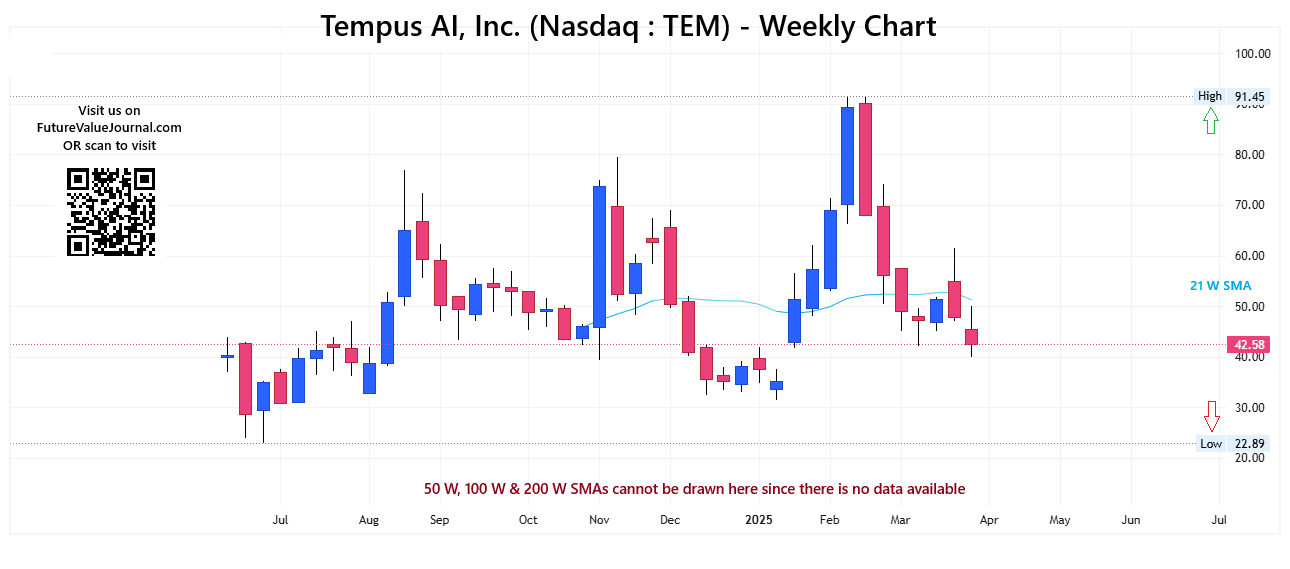 View Weekly Chart (Every candle represents Nasdaq : TEM share’s trading session of one Week. Each single candle represent the HIGH, LOW, OPEN, CLOSE of that particular week) | On Weekly time-frame, we can observe that TEM stock is trading BELOW 21 Weeks SMAs. This is the sign of Sideways to Bearishness in Long term. |
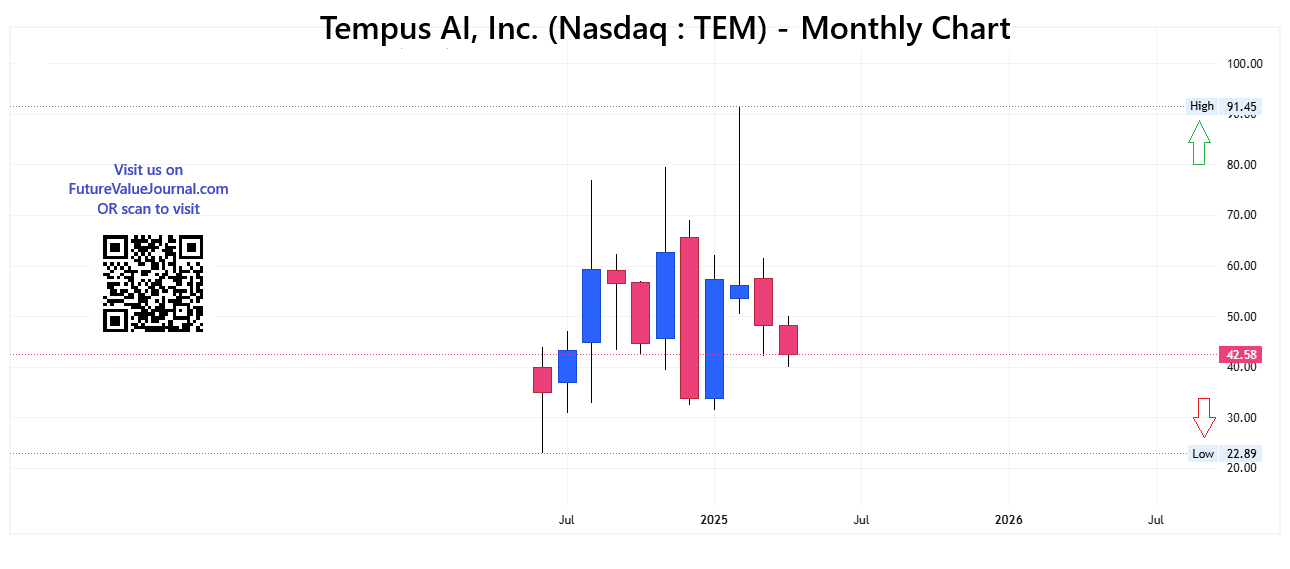 View Monthly Chart (Every candle represents Nasdaq : TEM stock’s trading session of one Monthly. Each single candle represent the HIGH, LOW, OPEN, CLOSE of that particular Monthly) | On Monthly time-frame, we can observe that TEM stock is trading Sideways. It is trading in the range of $62.85 – $35.68. This indicates that the TEM stock is in Sideways for Very Long term till it breaks its range. |
The major support can be seen at the levels of $33 – $34. Getting advice from a trusted financial adviser or stockbroker about AI industry can help you deepen your understanding of the market and create a long term investment strategy.
Dow Jones, NASDAQ & TEM : A comparative Analysis
Check out the comparative Month on Month returns of Dow Jones, Nasdaq and Tempus AI, Inc (TEM). Here, we are showing the returns by comparing them on closing basis –
| Month | DOW | NASDAQ | TEM |
|---|---|---|---|
| Mar 25 | -8.37% | -8.21% | -14.13% |
| Feb 25 | -2.41% | -3.97% | +4.75% |
| Jan 25 | -2.69% | +1.64% | +69.99% |
| Dec 24 | -9.23% | +0.48% | -46.00% |
| Nov 24 | -10.47% | +6.21% | +40.27% |
| Oct 24 | -9.61% | -0.52% | -21.17% |
| Sept 24 | +1.96% | +2.68% | -2.78% |
| Aug 24 | -1.63% | +0.65% | +37.20% |
| July 24 | +2.68% | -0.75% | +23.66% |
| June 24 | -7.95% | +5.96% | Listed |
Here in the above table we can clearly see that the Tempus AI Stock does not move in sync with the major indices. So, if someone is planning to trade TEM Stocks, he must not take any trading decision based on overall market movement.
Also Read : 📈 Laser Photonics | LASE stock forecast 2025 to 2050 with Analysis
TEM Peer Comparison / Competitors Analysis
We will compare Tempus AI, Inc (Nasdaq : TEM) to its top competitors. We will see how its peer companies performed year-on-year . Below is the comparative table of Qiagen N.V. (QGEN), Bio-Techne Corp. (TECH), Medpace Holdings, Inc. (MEDP), Bio-Rad Laboratories, Inc (BIO), Charles River Laboratories International, Inc (CRL)’s returns from 2020 to 2024 based on CLOSING Prices.
| Year | TEM | QGEN | TECH | MEDP | BIO | CRL |
|---|---|---|---|---|---|---|
| 2024 | +169.84% | +0.54% | -6.65% | +8.38% | +1.74% | -21.91% |
| 2023 | – | -12.91% | -6.90% | +44.31% | -23.21% | +8.49% |
| 2022 | – | -10.27% | -35.92% | -2.40% | -44.35% | -42.17% |
| 2021 | – | +5.17% | +62.92% | +56.35% | +29.61% | +50.80% |
| 2020 | – | +56.36% | +44.66% | +65.60% | +57.54% | +63.56% |
| Average Returns | +169.21% | +7.77% | +11.62% | +34.44% | +4.26% | +11.75% |
Here you can observe that TEM stock performed really well in its debut year when compared to its peer companies.
TEM Stock Price Forecast : Short & Long Term
TEM Stock Price Forecast 2025, 2026, 2027, 2028, 2029
| Year | Stock Price Target |
|---|---|
| TEM stock price forecast for 2025 | $ 70.13 |
| TEM stock price forecast for 2026 | $ 95.70 |
| TEM stock price forecast for 2027 | $ 125.04 |
| TEM stock price forecast for 2028 | $ 153.34 |
| TEM stock price forecast for 2029 | $ 182.13 |
- By 2025, we expect the TEM stock price forecast of around $70.13, representing a 64.7% increase from its current price of $42.58 (as of April 4, 2025).
- Looking ahead to 2026, we predict that TEM could rise to $95.70, a 124.7% gain, showing further growth.
- By 2027, we expect the stock to climb to $125.04, marking an impressive 193.7% increase.
- Moving forward to 2028, we anticipate the stock could reach $153.34, reflecting a 260.2% gain.
- Finally, by 2029, TEM could hit $182.13, representing a substantial 327.9% increase from today’s price of $42.58.
TEM Stock Price Forecast 2030, 2035, 2040, 2050
| Year | Stock Price Target |
|---|---|
| TEM stock price forecast for 2030 | $ 207.38 |
| TEM stock price forecast for 2035 | $ 279.57 |
| TEM stock price forecast for 2040 | $ 582.01 |
| TEM stock price forecast for 2045 | $ 735.27 |
| TEM stock price forecast for 2050 | $ 900.78 |
- By 2030, our long-term analysis forecasts TEM stock price reaching $207.38, which would represent a significant 387.2% increase from today’s price of $42.58 (as of April 4, 2025).
- Looking ahead to 2035, we estimate TEM stock price could reach $279.57, which would represent a remarkable 556.9% return.
- By 2040, we expect the stock to rise to $582.01, reflecting a substantial 1,266.7% gain from the current price.
- By 2045, we anticipate the stock could climb to $735.27, representing an impressive 1,626.6% increase.
- Further into the future, in 2050, we forecast TEM stock price could hit $900.78, indicating an extraordinary 1,914.6% increase from its current price.
TEM Stock Price Prediction 2025 (month-wise)
| Month | Stock Price Target |
|---|---|
| TEM stock price prediction for March 2025 | $50.65 |
| TEM stock price prediction for April 2025 | $53.79 |
| TEM stock price prediction for May 2025 | $59.85 |
| TEM stock price prediction for June 2025 | $62.02 |
| TEM stock price prediction for July 2025 | $64.19 |
| TEM stock price prediction for August 2025 | $65.98 |
| TEM stock price prediction for September 2025 | $67.61 |
| TEM stock price prediction for October 2025 | $70.13 |
| TEM stock price prediction for November 2025 | $66.27 |
| TEM stock price prediction for December 2025 | $64.62 |
As per our analysis of TEM stock price, we are expecting that the prices may rise up to $70.13, offering an approximate 64.70% return on its current price of $42.58 as of April 04, 2025. This represents a whooping return (ROI) for investors.
Also Read : 💰 Nvidia Stock Price Forecast 2025, 2030, 2040 & 2050 with COMPLETE ANALYSIS
Conclusion
In conclusion, Tempus AI Inc. (NASDAQ: TEM), founded in 2015 and based in Chicago, stands at the intersection of AI technology and healthcare. With a market cap of $7.33 billion USD, the company has shown strong potential in the AI-driven health sector.
Despite reaching an all-time high of $91.45 USD on February 14, 2025, the stock has been moving sideways across various timeframes. While short-term performance remains bearish, Tempus AI’s innovative approach and position in a growing industry make it a stock worth watching for long-term investors.
Frequently Asked Questions (FAQs)
1) Will TEM stock price reach $100?
As per our current analysis, it will be really hard for TEM stock price to reach $100 in coming months. But if market conditions become favorable or Tempus AI Inc. innovate some groundbreaking AI tech, we can expect this price also.
2) Is TEM a good stock to buy, sell or hold?
In our opinion, its recommended to Hold this stock if you already have it in your portfolio. But if you are looking for a fresh buy, wait for a while until it gives a new breakout.
3) What is the TEM stock price forecast for 2030?
In 2030, we are expecting TEM stock price to reach around $207.38 per share.
4) What is the TEM stock forecast for 2050?
During 2050, we can see TEM stock price to hit $900.78. Although it can worth way more than that if it continues to innovate new AI tech for health industry.
5) Is Tempus AI Inc. a long term investment?
In our opinion, if you are thinking for longer term, you should consider this stock in your watchlist. Whenever it gives a decent breakout, you can put some of your capital into in. Since AI is evolving, we cannot ignore its presence as well as applications in health industry.
6) What is the TEM stock price prediction for 2025?
As per current market conditions, TEM stock price could reach up to $70.13 per share in 2025.
7) What is the TEM stock price forecast for 2026?
$95.70 per share could be the TEM stock price forecast for 2026.
8) What is the TEM stock price prediction for 2027?
$125.04 per share could be the TEM stock price prediction for 2027.
9) What is the TEM stock price forecast for 2028?
$153.34 per share could be the TEM stock price forecast for 2028.
10) What is the TEM stock price prediction for 2029?
$182.13 per share could be the TEM stock price prediction for 2026.
Disclaimer : Not an Investment Advice
The content shared here in “Tempus AI Inc. | TEM Stock Price Forecast 2025-2050” is for general information only. It’s not intended as financial, investment, or professional advice. Always consult a qualified professional—whether legal, financial, or tax-related—before making any investment decisions.


9 Comments